|
<< Click to Display Table of Contents >> Ventity™ Menus |
  
|
|
<< Click to Display Table of Contents >> Ventity™ Menus |
  
|
File Menu
` Create, open, save and close models.
|
Edit Menu
Work with your most recent actions or with objects selected on the screen.
|
View Menu
Open Ventity panels if they are not already showing.
|
Model Menu
Create or import new entity types, run the model.
|
Help Menu
Get information about Ventity.
|
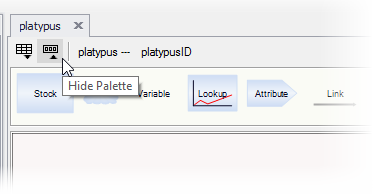
The Node Palette appears at the top of any diagram window:

Each node can be dragged onto a diagram to create a new variable, attribute, reference or annotation.
•Dragging the Stock, cloud ![]() , Auxiliary, Lookup, Attribute, or Trigger node to an entity's diagram creates a new property of that type for that entity.
, Auxiliary, Lookup, Attribute, or Trigger node to an entity's diagram creates a new property of that type for that entity.
•Clicking one of those items in the palette turns the cursor into a tool that adds that object. If you click on Stock, subsequent clicks on the diagram will add stocks to the entity type definition. Use the escape key (ESC) or click on a different tool in the palette to return to the normal cursor mode.
•The Link tool turns the cursor into a tool for drawing perpendicular links among variables or attributes. Use the escape key (ESC) to exit perpendicular link mode. (Curved arrows may be drawn without use of a special tool. Just float the cursor over the edge of the source node until it turns to a hand, then click and drag an arrow to the target node.)
•Dragging the Group node to an entity's diagram creates a hyperlink to a new, empty second diagram for the same entity type.
•Dragging Label, Notes, or onto a diagram adds, respectively, a large-font title or a text field for writing comments.
•The Chart node adds an embedded chart to a diagram. Embedded charts update automatically as runs are simulated.
•
The node palette can be hidden or revealed with the show/hide palette button:
