|
<< Click to Display Table of Contents >> Diagrams |
  
|
|
<< Click to Display Table of Contents >> Diagrams |
|
Diagrams are used to define entity types, collections, actions, custom MACROs, and components.
Diagrams show model elements and the causal relationships among them. Each entity type is automatically given a diagram named for the entity type, but you can add or remove diagrams as you wish. The diagrams for an entity type are listed in the diagrams tab of the inspector. By default, diagrams appear in the upper central part of the Ventity workspace.

The most important thing to remember about diagrams is that they exist only to help you organize and communicate your ideas. They do not define the entity type. The entity type is defined by what is in the inspector, not by what is in the diagrams. A variable, attribute, action or collection that is in the entity inspector can be in one diagram, or in many diagrams, or in no diagrams. In all cases, if it is in the entity inspector, it is an active part of the model calculation.
This gives you great freedom in how you organize diagrams for an entity type. When one main diagram no longer suffices, one option is to break the entity type definition into separate sections, each with its own diagram. So, your rainforest entity type might have a diagram devoted mostly to flora, another devoted mostly to fauna, and another devoted mostly minerals and water. However, for a particular audience you might want to show a diagram focusing on the canopy. You can create a fourth diagram involving elements from the other three, relevant to life among the tree branches, without changing the model calculation structure.
To add a diagram to your entity type definition, use the + button at the bottom of the 'diagrams' tab on the entity type inspector. Enter a name for the diagram when prompted.
Diagrams are not just for entity type definitions. Collections and Actions each may have properties and calculations associated with them. Thus, they too appear in the model overview panel, have their own inspectors, and can have one or more diagrams.
Diagram elements include:
Nodes are symbols for the various Ventity™ objects: stocks, flows, auxiliaries, attributes, actions, and collections. Available nodes are shown in the Node Palette at the top of each diagram.
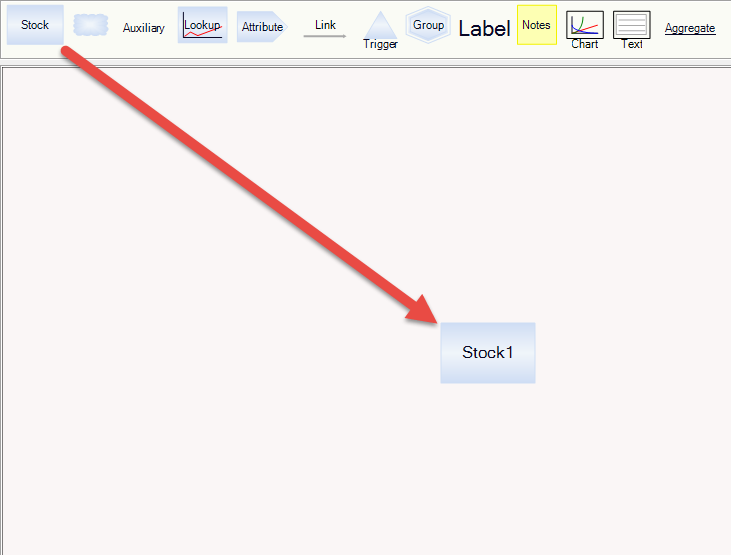
To create a new node, drag the desired symbol from the palette to a diagram,
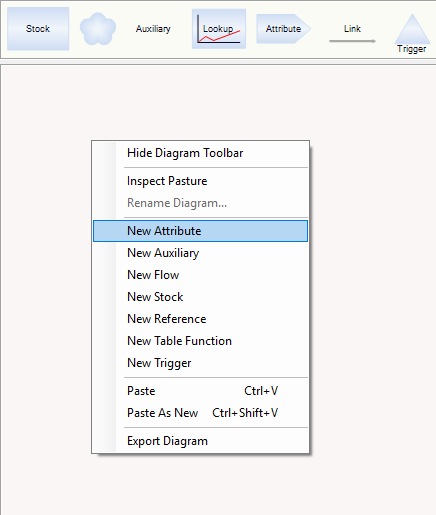
•or, click an empty space on a diagram and select "New attribute" (or stock, auxiliary or flow).
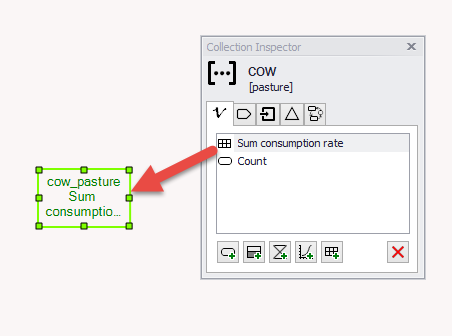
•To create a node for an existing object, drag the name of the object from the Entity Type Inspector onto the diagram.
To move a node on the diagram, drag it by its name. To resize, click name once to select.
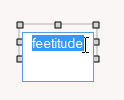
To rename, click once to select, then click on the name.
You can select multiple nodes using shift-click, or by clicking an empty space on the diagram and dragging a selection rectangle around the desired nodes. While you have multiple nodes selected, you can de-select individual unwanted nodes by holding down the ctrl key and left-clicking on the nodes you wish to deselect.
Right-clicking or double-clicking a node raises a menu of relevant commands regarding that node. For example, the menu that appears when right-clicking stocks includes an "add inflow" command:
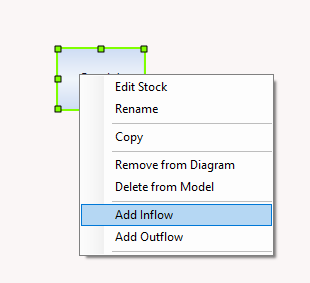
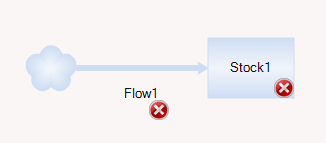
Selecting "Add Inflow" will put inflow to the stock on the diagram:
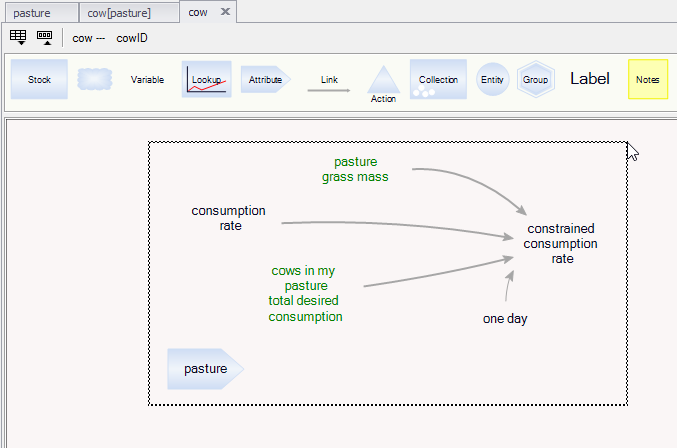
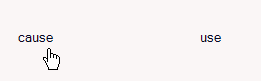
The dependency of one variable on another is shown in diagrams by an arrow pointing from cause to use. The dependency indicated by arrows in diagrams must match the equation of the dependent (use) variable. Ventity will supply any needed arrows as you provide equations, or, you can draw an arrow from one variable to another in a diagram.
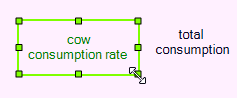
To draw an arrow, position the cursor over a variable, in the area surrounding the name but not directly over the name, until the cursor becomes a hand.
Click and drag from the first variable to the second:
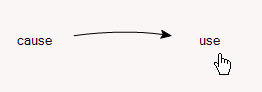
When you release, you will see green and yellow handles on the arrow,
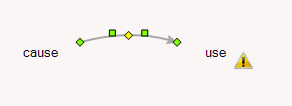
these handles are used to adjust the arrow path. Click and drag the center (yellow diamond) handle to make gross adjustments to the arrow path. Drag either of the two green square handles to either side of the yellow diamond to make finer adjustments. You can change the arrow's origin or destination object by dragging the first or last handles (green diamonds). Clicking the first or last handle will cause Ventity to re-attach the arrow to the node at a more suitable point.
The warning sign ![]() is shown if the causes of a variable as shown by arrows do not match the causes indicated in the equation. Adding missing arrows or removing unused arrows will automatically resolve the warning.
is shown if the causes of a variable as shown by arrows do not match the causes indicated in the equation. Adding missing arrows or removing unused arrows will automatically resolve the warning.
To draw a perpendicular arrow made only of horizontal and vertical segments, click the link tool ![]() in the palette before drawing the arrow. The escape key (Esc) will release the link tool and return Ventity to its normal drawing mode.
in the palette before drawing the arrow. The escape key (Esc) will release the link tool and return Ventity to its normal drawing mode.
Arrows indicating causes that are used only for initializing variables are shown in a different style, which can be changed through the Styles editor (see below).
A shadow variable is simply an appearance of a node with causal arrows suppressed. You can recognize from its different appearance that an object is a shadow, and that its causes are not being shown. The default appearance of a shadow is a green-color font; this can be changed in styles definitions described below.
Shadows are used to prevent the overload of arrows that could occur when every cause of every variable is shown, as (for example) when an object appears more than once on a diagram. Shadows are also used to indicate a reference to a property of some other entity.
Pipes on a diagram indicate flows. Flows must connect stocks, or clouds. To move a pipe on a diagram, click the pipe to show the green handles. Drag the middle handles to change the pipe's path. Drag the handles at either end of the pipe to a new origin or destination to reroute the flow.
The Button tool allows a user additional functionality and can be useful for navigating between diagrams.
To add a Button to a diagram, simply select and then place the Button from the Ventity toolbar on the model workspace.
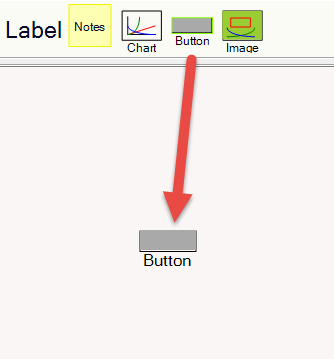
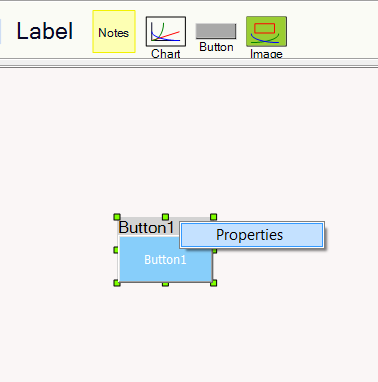
Once the Button is placed, it can be renamed by left-clicking the title bar, and its purpose can be set by right-clicking the title bar and selecting "Properties".
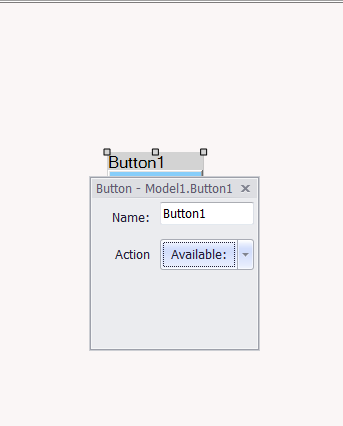
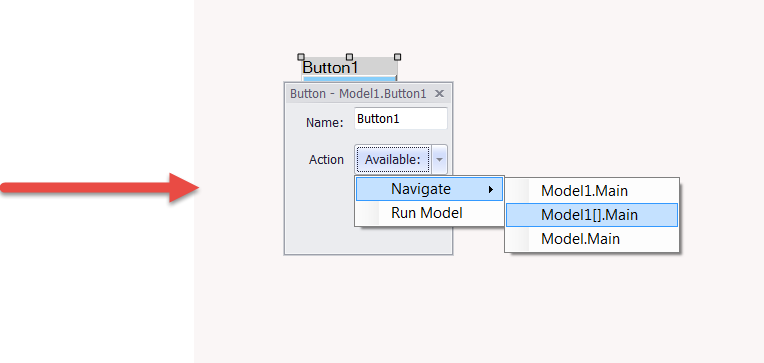
A pop-up menu will allow you to rename the Button, and/or to select its use. You can set the Button to navigate to any one of your model Entity Types, or to Run the model when used in Application Mode.
The color of the Button can be changed through this same menu.
The Image tool allows you to add and resize images into Ventity diagrams.
Ventity will recognize any image file type (.png, .jpg, .bmp, etc),
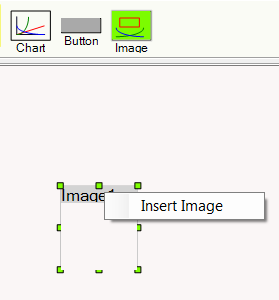
To create an Image, simply drag (or click and drop) the Image tool from the toolbar where you want the image to appear on the screen.
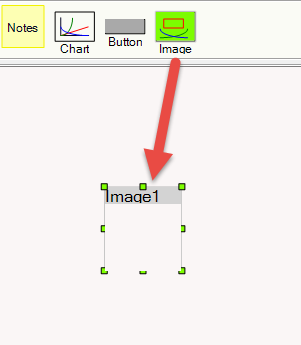
A new box will be created. To connect it to your image file, right click the title bar of the newly created box and an option to "Insert Image" will appear.
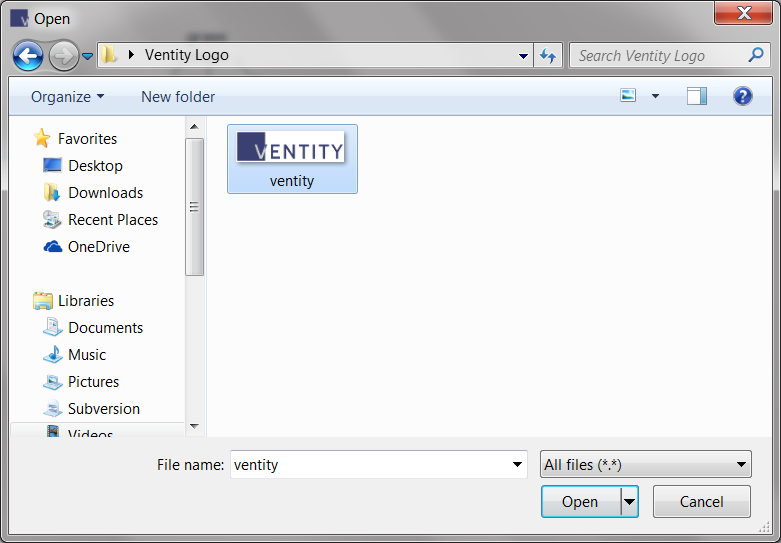
Select "Insert Image" and navigate to the image you'd like displayed.
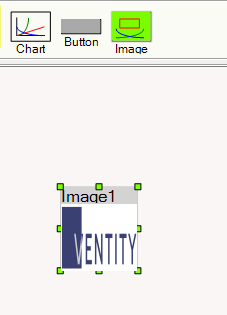
Note: The image is automatically scaled to fit the size of the box. To resize the image, simply drag the handles of the box.
After placing an image in a model, the image will be copied and saved in the "Media" folder of the model. This will preserve the image in the model even if the original file is deleted or moved.
To cut or copy an object or a portion of a diagram,
Select the items by clicking and dragging a rectangle around them, or shift-click to select multiple objects. The entire diagram may be selected by choosing "Select All" (Ctrl-A) from the Edit menu.
Cut or copy the selected structure from the Edit menu, or by right-clicking, or from the keyboard using Ctrl-X (for cut) or Ctrl-C (for copy).
When pasting, you have two options: "Paste" (Ctrl-V) or "Paste as New" (Shift-Ctrl-V).
•"Paste" will place the cut or copied objects at the new location.
oIf those same objects are already present, or if the new location is part of a different entity type definition, shadows will be pasted instead.
oIf it is ambiguous whether you mean to be pasting an object from an entity itself, or from a related entity of the same type, you will be asked to select. For example, if your "person" entity type has an "age" variable and a "father" attribute, and you copy and paste "age" back into your person entity type definition, you will be asked whether you mean to use the age of the current entity ("my age") or its father's age ("father age")
•"Paste as New" will create new objects, identical to the copied objects, and place them in the new location. If objects of the same names exist in the new location, the new objects will be renamed by adding a "2", "3", etc. to the original name.
If an entity type has a large or complex diagram, it is useful to break up the overall structure into smaller pieces. Each piece, called a group, has its own diagram. Each group can be represented on other diagrams using a group node.
To create a new group, drag the group node onto a diagram. A new, second diagram will be created, and the group node in the first diagram will become a hyperlink to the second.
To create a group node for an existing diagram, drag it from the diagrams tab of the entity inspector onto a second diagram. A group node for the first diagram will be created on the second diagram.
To export a diagram or portion of a diagram, select the desired objects and copy the desired structure (Edit menu > Copy or Ctrl-C).
To paste into Microsoft® PowerPoint, open PowerPoint to the slide where you wish to paste the diagram. Use "Paste Special" and select "Picture (Enhanced Metafile)." The resulting picture may be resized. To edit in other ways, right-click and choose Edit Picture. When prompted to convert to a Microsoft Office Drawing Object, click "Yes". Right-click the image and choose Group>Ungroup. You may then select and edit various elements of the diagram.
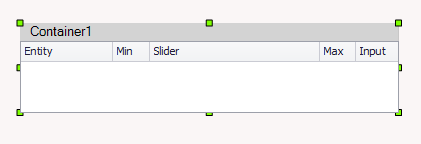
The Multi-Slider Bar allows a user to change the numeric value of a constant variable to another value and have the model re-run with this new number.
To use the Multi-Slider Bar, select it from the diagrams bar by left-clicking and place it anywhere on the diagram. To move the multi-slider after placing it, simply select it by left-clicking and drag the title bar.
To modify the functionality of the Slider Bar, right-click on the top of the Slider Bar (where the title is displayed) and a menu will appear.
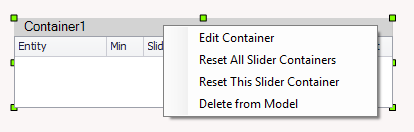
Edit Container provides all of the options for assigning the constant variable and setting the minimum and maximum values it can "slide" between. Adjusting the precision will change to what decimal place the slider will detect.
Reset All Slider Containers resets ALL sliders in the model, not just the currently selected container.
Reset This Slider Container resets ONLY the selected container's sliders.
Delete from Model removes the container completely from the model.