|
<< Click to Display Table of Contents >> Lookup Tables |
  
|
|
<< Click to Display Table of Contents >> Lookup Tables |
|
You may provide your own table of values for Ventity to use as a lookup function. In Ventity, such functions are called "table functions" or "lookup functions" interchangeably.
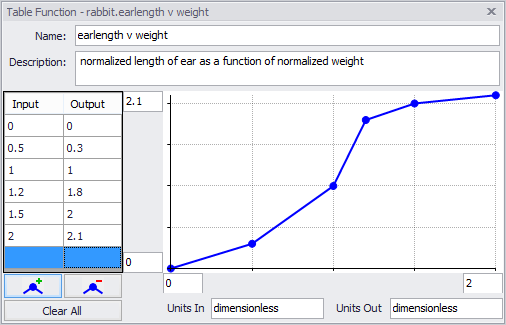
Drag a Lookup icon ![]() from the palette onto a diagram and name the lookup. If you right-click to edit the function, you will be presented with an x-y table and graph. The x-axis represents input values, and the y-axis shows the corresponding output. Fill in the table directly, or by clicking on the graph to add points. Once added, points may be dragged to new locations. To delete points, switch to "Delete Mode", and click on any points you wish to delete. The graph window will automatically expand to include all points on the table. You can make the window larger with the min and max fields near each graph axes. Use the units fields to indicate the units of the inputs and outputs of the function.
from the palette onto a diagram and name the lookup. If you right-click to edit the function, you will be presented with an x-y table and graph. The x-axis represents input values, and the y-axis shows the corresponding output. Fill in the table directly, or by clicking on the graph to add points. Once added, points may be dragged to new locations. To delete points, switch to "Delete Mode", and click on any points you wish to delete. The graph window will automatically expand to include all points on the table. You can make the window larger with the min and max fields near each graph axes. Use the units fields to indicate the units of the inputs and outputs of the function.
Note: If input values are below or above the domain of the table, Ventity will extrapolate the function as needed using the slopes defined by the first two points for inputs less than the defined domain, and the last two points for values greater than the defined domain.
Once created, a lookup table can be edited in the built-in data, and will follow the same rules as other built-in data. This uses the same interface as when you edit the tables in the Model Workspace, but alternatively will accept a pasted input in (x1, y1), (x2, y2)... etc. format. This can be especially helpful if copying in data from a outside spreadsheet source.
For more information on built-in data and its handling, click here.
All of the table functions require a linked table. To link a table, simply create an auxiliary to house the function and draw a line from the table to the auxiliary, or in the arguments for the table function, write in the name for the table, right-click the underlined name and select "Draw arrow from (table name)".
Note: Ventity will automatically check for units mismatch in table functions and display an error message to console if one is found on model run.
LookupArea (table)
|
Returns area under the line of the table function. |
LookupAreaByRange (table,x,time)
|
Starting at x value, returns area under the line of the table function.
|
LookupExtrapolate (table,x)
|
Calculates slope of the line, then returns expected y value for given value of x using that slope.
|
LookupForward (table,time)
|
Next y value is used between x values instead of being interpolated.
|
LookupBackward (table,time)
|
Previous y value is held between x values instead of being interpolated.
|
LookupInvert (table, time)
|
Inverts lookup for x and y values, returning y for x. |
LookupSlope (table,time)
|
Returns the change in y divided by the change in x from one point to the next point.
|
LookupMaxValue (table)
|
Returns highest value of y the table. |
LookupMaxValueByRange(table,x1,x2)
|
Returns highest value of y for the table between the two given x values (x1, x2).
|
LookupMinValue (table)
|
Returns the lowest value of y for the table. |
LookupMinValueByRange (table,x1,x2)
|
Returns lowest value for y of the table between the two given x values (x1, x2) |
The table function you provide in the entity type definition is the default, but an individual entity can have its own values for the table function. Individual overrides for table function values are provided during initialization.