|
<< Click to Display Table of Contents >> GIS Visualizer |
  
|
|
<< Click to Display Table of Contents >> GIS Visualizer |
|
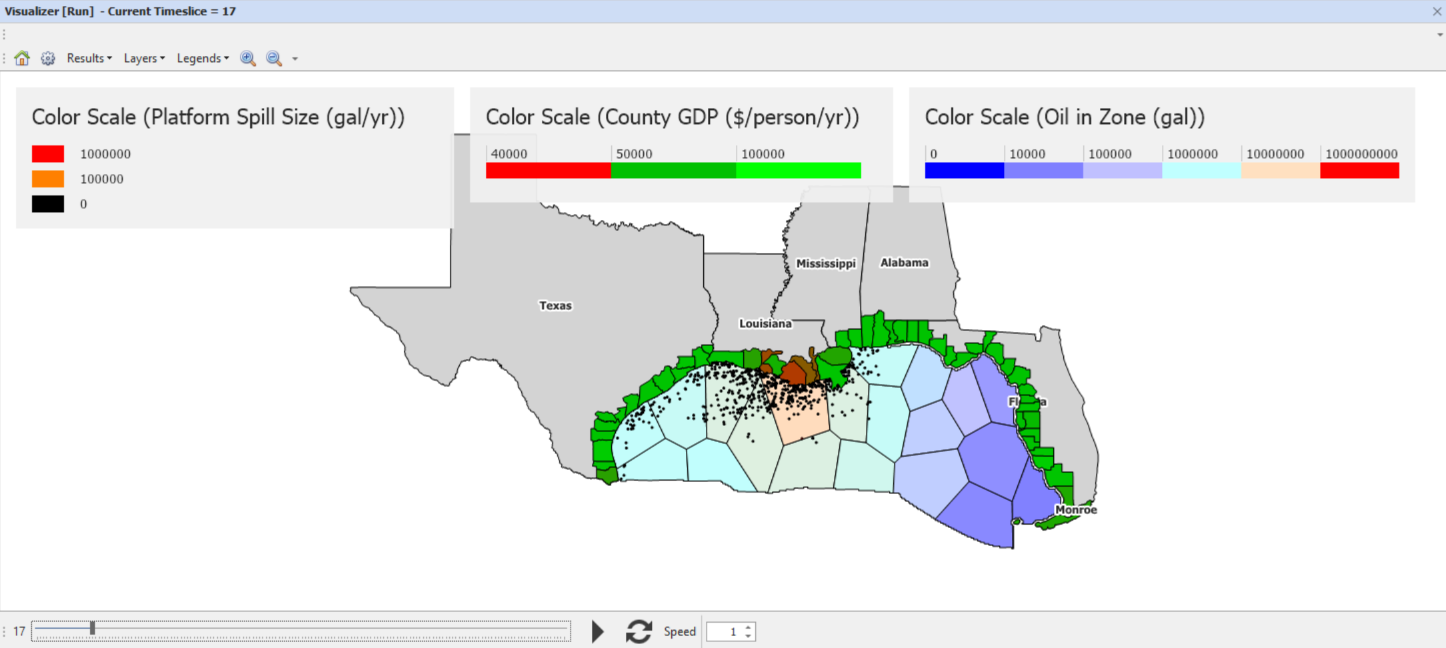
Visualizations allow for displaying the results of your model in an animated map.
The example in this topic is contained in the GOM GIS 2 sample model in the Applications folder.
1.Run the model.
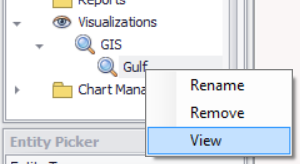
2.Expand the Visualizations item in the Model Overview.
3.Expand the GIS visualizations list.
4.Right-click a Visualizer and select "View" (or, just double-click as a shortcut).
To begin setting up a Visualization, you should have a few things to start. Firstly, you'll want a runnable model, as the Visualizer only displays the results of calculated variables from your model.
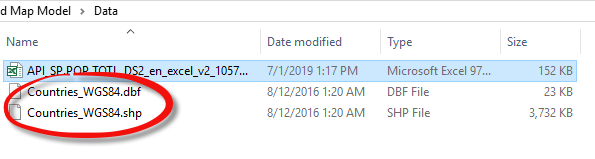
Second, you'll need maps - both a shape file and its associated data, in a .shp and .dbf file respectively. The .shp file will provide the display for the visualization, while the .dbf will create the mapping from the results of your model to the relevant objects in the Visualization. Note that shapefiles should use the WGS84 datum, though similar systems may work over limited areas. UTM currently will not work. You can easily reproject a shape file using a tool like QuantumGIS or ArcGIS.
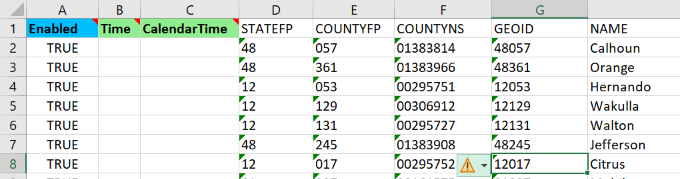
The .dbf file is a dbase database file, containing attributes for each point or polygon in the shape file. Excel can open a .dbf file as a worksheet. This makes it very easy to create entity initialization data matching the shape file. Simply open the .dbf, add the columns required for entity initialization data (enabled, time, calendartime), and make sure that one column name matches the key attribute of the entitytype. Change the name of the worksheet to match the entitytype name, save, and import the result into Ventity.
If you have both of these files, place them in the Data folder of the model for which you're creating a Visualization. (You can also link to shape files outside the model's data hierarchy, but these will be absolute links, making the project reliant on a consistent directory structure if moved to another computer.)
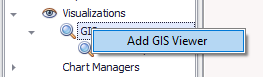
Now, open the model in Ventity. Expand the Visualizations tab and right-click on GIS. Select "Add GIS Viewer".
This will create a new Viewer named "New Viewer 1". Now, run the model. Once the model has finished running, double-click on the Viewer or right-click and select "View". Note that this option only appears after the model has been run.
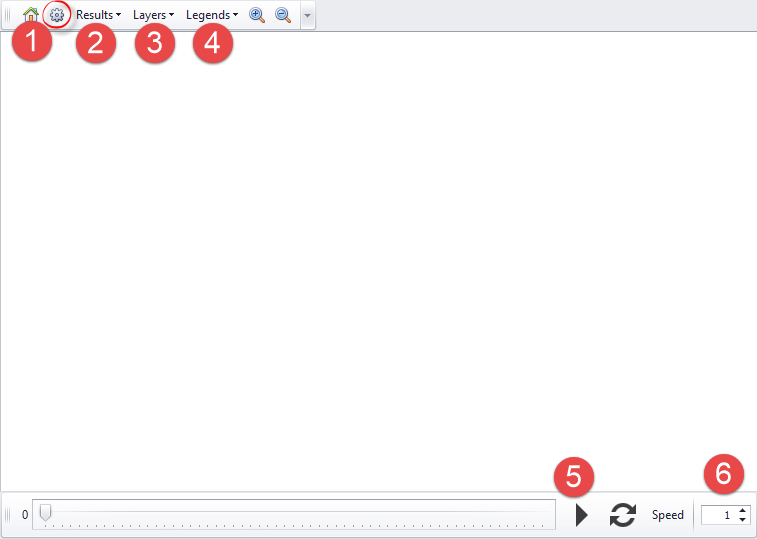
This will open a blank screen with a few options, we'll review the rest later, but for now navigate to the gear widget (1) and left-click on it.
This will open a new screen with all of the options you'll need to connect your Ventity run results to your .shp and .dbf files.
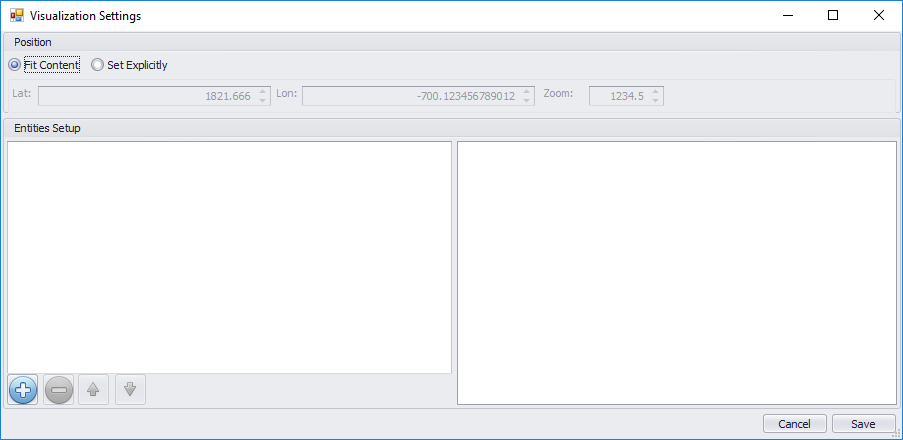
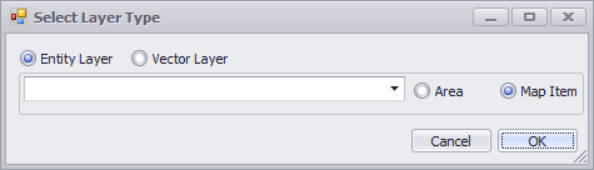
Click on the plus icon to add a new entity. From here, you'll be prompted to select whether the new entity will be an entity layer -- something which will be linked to a layer in your .shp file and a entity in your model -- or a vector layer -- a display-only .shp file (useful for base map layers).
Within entity layers, there are two options: Map item or Area.
•An Area item is a shapefile polygon linked to an entity by matching an ID field and attribute.
•A Map Item is a point. Creating a Map Item will identify and list several variables within entities to change the behavior of the Map Item: latitude, longitude, size, and color can all be assigned and changed purely through the entity itself.
For example, if you wanted to track a cow moving across a grassy knoll and eating it, the cow could be a Map Item with the grassy field it walks across an Area tied to a .shp file.
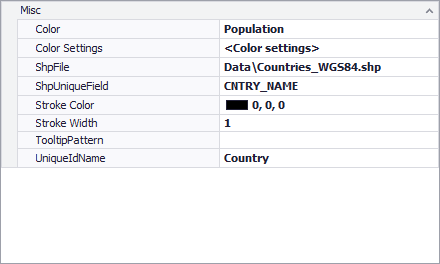
The first step for adding any entity layer is to tie it to an entity in your model. For Map Items you will then need to define links for the latitude, longitude, size and color. For Areas you will need to define the connections for the ShpFile (the .shp file located in the Data folder of your Ventity model) and the ShpUniqueField (the names stored in the .dbf that will tie to entities in your model). Note that these names must match exactly for the information to be properly displayed. Color is based on the variable within the entity you're measuring the value of, and ColorSettings allows you to define parameters for the color changing based on the entities value.
When finished, a Area item should look like this:
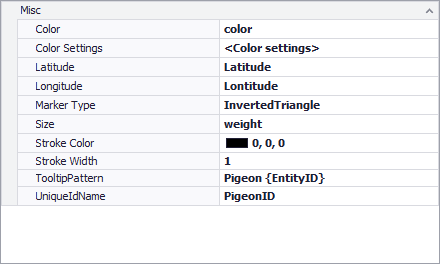
And a Map Item like this:
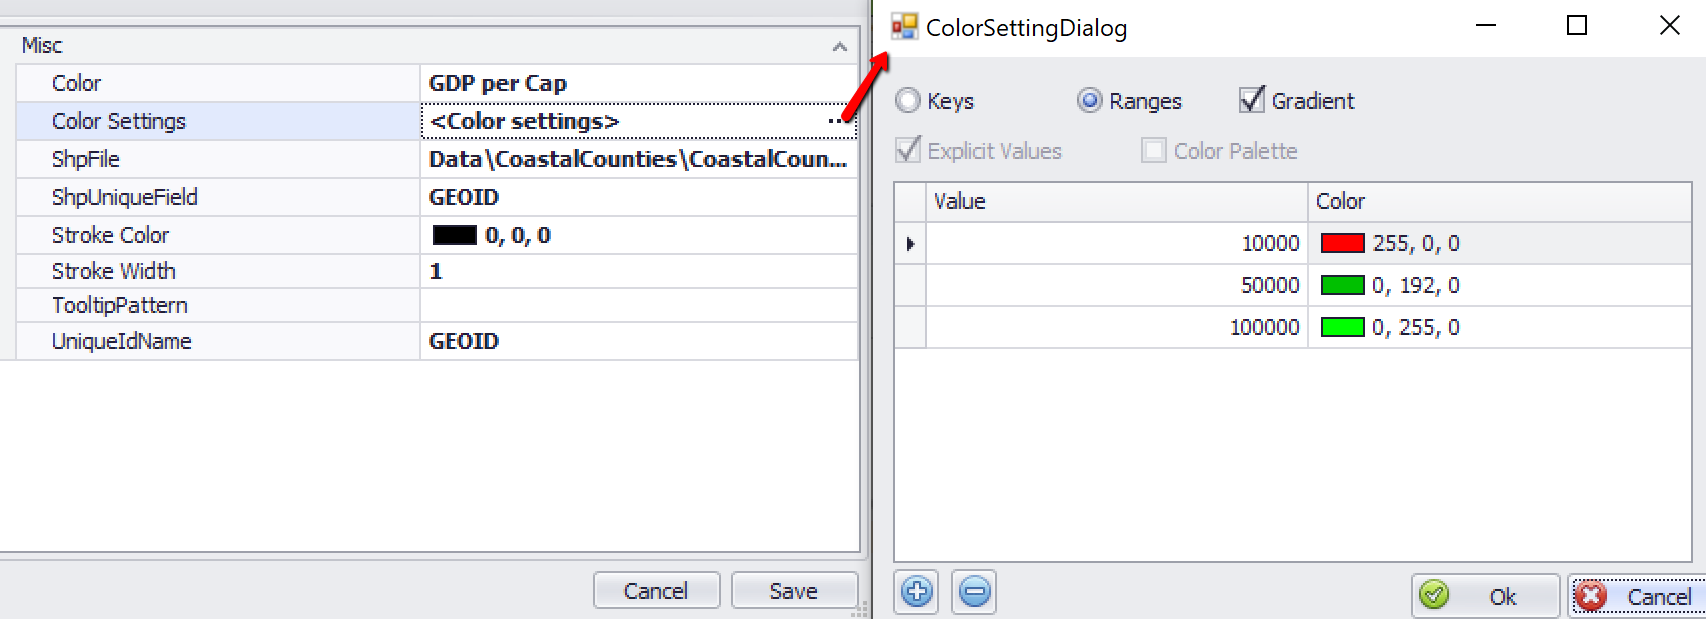
Note: Be sure to populate the Color variable field; an empty selection may trigger a known bug, and obviously you'll want to use it for aesthetics and information.
Typically, a gradient linked to variable values will be the preferred setting:
The TooltipPattern field permits you to control the information shown when hovering over a map feature.
•You can put any text you want
•Some html formatting applies, like <br> for new line and <b></b> for bold
•Variables are introduced using curly brackets {}.
oInside those brackets you can either put the name (case sensitive) of the shp file attribute (in screenshots bellow it's the GEOID, you can use other attributes as well), or
oYou can put one of the two Ventity reserved keywords:
▪EntityColor (which in this example will evaluate to the Population variable) or
▪EntityID (which in this example will evaluate to the GeoId attribute)
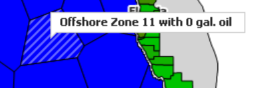
Example: the pattern Offshore Zone {EntityID} with {Oil} gal. oil yields:
Once completed, close out of the Visualization Settings screen and save your additions by clicking "save" in the bottom right. Now, all of the additions should be displayed. If they're not, navigate to the Results (2) and Layers (3) tabs and ensure everything is checked. Unchecked items will not be displayed, and the Results tab controls, if there are multiple runs, which is displayed in the visualization at any one time.
The Legends (4) tab toggles which of the legends for your layers are displayed, and the eyeglasses next to them control the zooming in and out of the visualization. The arrow key at the bottom (5) will play through the model's run, while the loop button beside it toggles whether or not the run will play on a loop once it reaches the end of its run. Speed (6) determines how many timesteps are displayed per visualization tick.