|
<< Click to Display Table of Contents >> 3D Visualizer |
  
|
|
<< Click to Display Table of Contents >> 3D Visualizer |
|
The 3D Visualizer lets you animate scatterplots of entities in 3D or 2D.
The example in this topic is contained in the Swarm 3 sample model in the Applications folder. In that model, a swarm of agents scales "features," which you can think of as hills. Agents move randomly, and by climbing gradients to other agents they perceive to be higher or lower.
Note: The 3D Visualizer feature is in its early days, so we particularly welcome feedback on bugs, usability and feature enhancements.
1.Run the model.
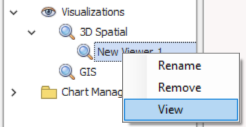
2.Expand the Visualizations item in the Model Overview.
3.Expand the 3D Spatial visualizations list.
4.Right-click a Visualizer and select "View" (or, just double-click as a shortcut).
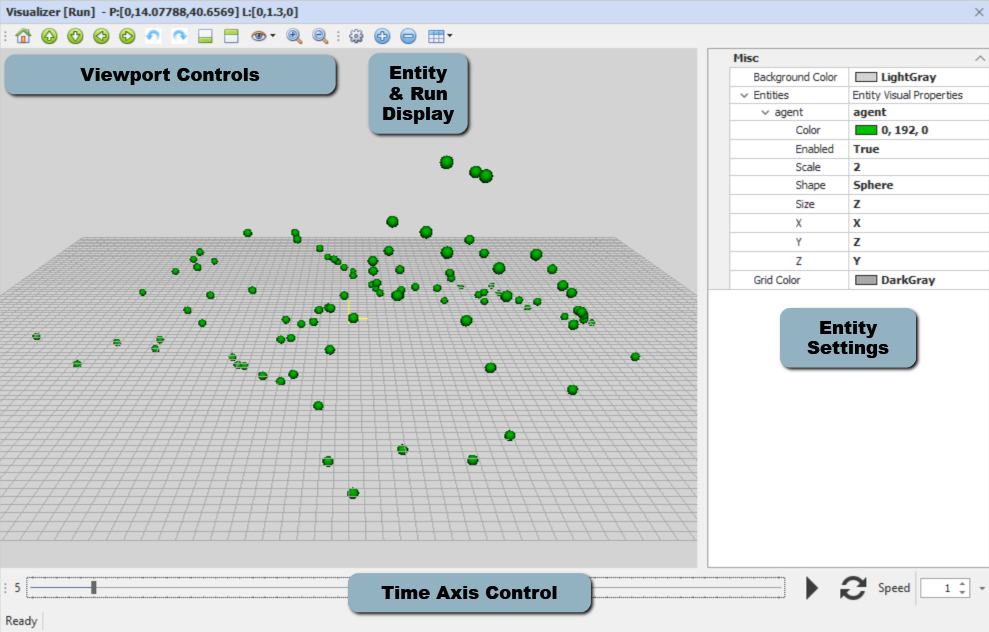
Once the visualizer window opens, you can control the viewpoint with the viewport controls in the top left toolbar, and by rolling the mouse wheel. The time axis control allows you to select a time slice, or hit the "play" button to run an animation. Appearance of individual entities can be controlled by the settings panel at right.
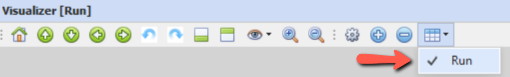
Note that visualizers don't automatically refresh their data when the model runs. You can force a refresh by closing and reopening the viewer, or by reloading the run via the toolbar Results grid control:
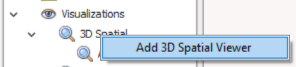
1. Right-click the "3D Spatial" category in the Model Overview and select "Add 3D Spatial Viewer"
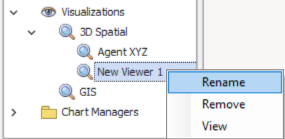
2. You may want to rename it more descriptively:
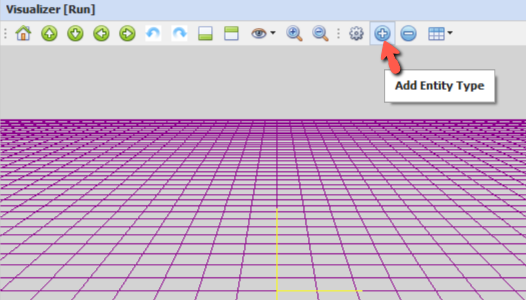
1. Double-click or right-click to open the new viewer, which will be empty initially.
2. Click the [+] button to add an entitytype to the visualizer.
3. Choose a type from the dialog menu:
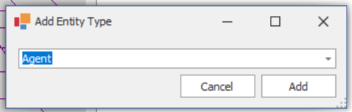
4. Settings for the new entity type will appear in the settings panel.
5. Populate the settings, as below.
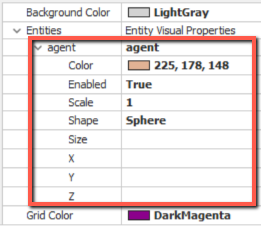
An entity type entry in the visualizer has 8 settable properties. The first four (color, enabled, scale & shape) apply to all entities of the type.
Color |
RGB color to be shown for all entities of this type |
Enabled |
Controls display of the entity type - True or False |
Scale |
A scaling factor for the size of all entities of this type (does not affect XYZ location) |
Shape |
The shape for all entities of this type - sphere, cylinder, cone or torus. |
The second four (size, x, y, z) distinguish individuals.
Size |
Variable to link to the size of each entity |
X |
Variable to link to the X coordinate of each entity |
Y |
Variable to link to the X coordinate of each entity |
Z |
Variable to link to the X coordinate of each entity |
Note that size, x, y & z currently don't support fixed numeric entries. If you want all entities to share the same coordinate, you can place a constant variable in the entity equations.
Because very large or very small values may display poorly, it may be useful to create some explicit variables in the model that normalize output values to a consistent scale, so that XYZ values have a consistent range and size is a modest % of the XYZ distributions.
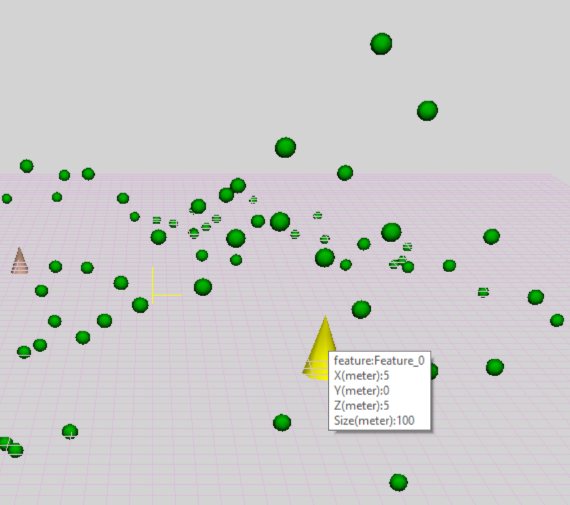
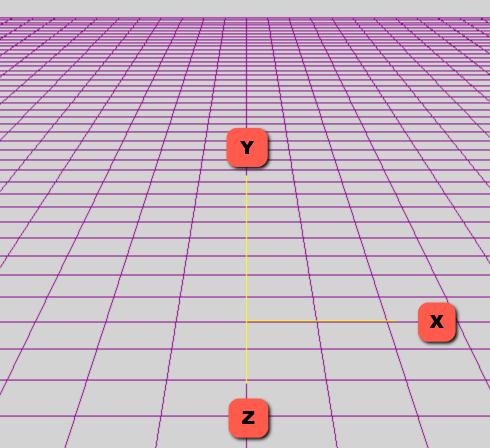
Note that the XYZ layout may not be what you'd expect. In the home orientation, X increases to the right, Y increases up, and Z increases to the front. For this reason, in the sample model, the variable mapping assigns Y->Z and Z->Y, to give the Agent.Z variable the expected sense of "up".
You can repeat the process to add additional entities to the visualization. For a sensible display, the entity variables should share the same XYZ coordinate system. Tooltips identify features when you hover on them.