|
<< Click to Display Table of Contents >> Sensitivity Analysis |
  
|
|
<< Click to Display Table of Contents >> Sensitivity Analysis |
|
Sensitivity Analysis is used to test the model and system reaction to variations in input parameters. Ventity provides several types of analysis for this purpose. Sensitivity Analysis is accessed through the Model Overview pane.
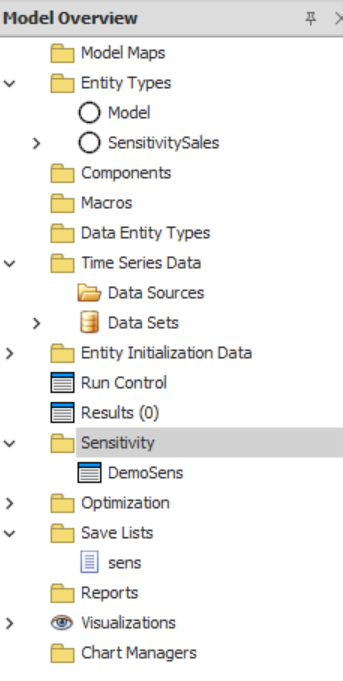
To add a new sensitivity definition, right click on the Sensitivity tab and select "New Sensitivity".
To edit an exisiting definition, right click on the analysis and select "Edit".
To make a copy of an existing definition, right click and select "Duplicate"
To delete a definition, right click and select "Delete".
The Edit Window
.
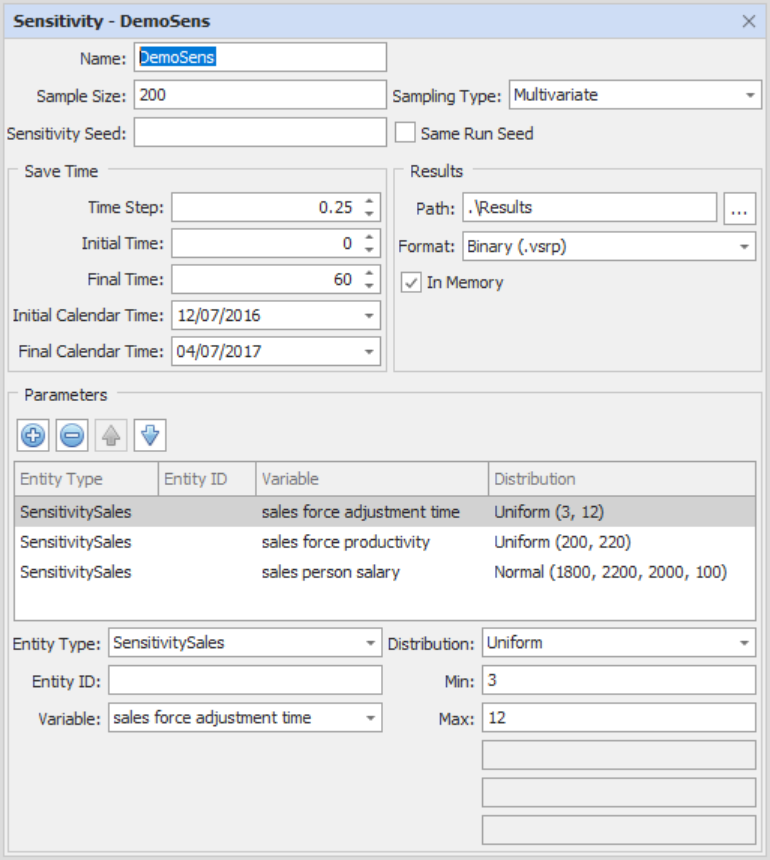
The top portion of the dialog sets the analysis scope. The bottom portion specifies detailed parameters and distribution methods.
Sampling Size:
Sampling Type:
Univariate - one variable at a time.
Multivariate - all variables at the same time.
Latin Hypercube - ensures full range of each parameter is searched within the number of simulations (set via Max Samples) provided.
Grid - similar to multivariate with vector distributions for the parameters. The number of simulations specified is the number of divisions, and will be raised to the power determined by the number of search parameters to determine the actual number of simulations required. Grid runs can take a very long time and should not be used with long lists of parameters.
Sensitivity Seed:
As with an optimization run, you'll need to provide a name (1), define the parameters (2), and adjust the settings (3) of the run.
To add a sensitivity run, click the ![]() icon. Once you've added the run, you can left-click on Name to set the name of the run.
icon. Once you've added the run, you can left-click on Name to set the name of the run.
Left-click <Params> field beneath Parameters to set the variables (beginning with Entity Type, which will populate all of the relevant variables in the list) and distribution for the sensitivity run. Currently, you can select between a normal, uniform, exponential, binomial, negative binomial, Weibull, Poisson, gamma, triangular, beta, or vector distribution.
Once you're finished setting the parameters for your sensitivity run, take a moment to adjust the settings (in particular the Max Samples setting, which determines how many iterations of runs will be made and defaults to 200) before running your model. There are several settings currently available for sensitivity runs with more in the works.
Results will, by default, be displayed automatically during and at the end of the run.To adjust these settings, see Save Period below.
Graphs have two display types which can be toggled between in the upper-left: confidence bounds and individual runs. You can choose to isolate only those runs above or below a certain confidence bound in the confidence bound display setting by right-clicking on the section you're interested in and selecting the option from the drop-down list.
Finally, there are three additional options accessed through the Run Control for Sensitivity runs. These are: Sensitivity Results Path, Sensitivity Results Format, and Sensitivity Results in Memory.
Sensitivity Results in Memory is a toggle which determines whether or not the model will run and save the results of your sensitivity run in the memory of your computer or directly write the results to a file of the format you set in Sensitivity Results Format. Enabling this option will decrease the run time for your model, but will also not display any of the automatic results. If you want to see the results from your run, you'll have to load the data from the file you saved it as into the model.
Sensitivity Results Format determines the type of file that your sensitivity run results is saved as. Currently, the only options available are Tidy (.csv) and Binary (.vsrp).
Sensitivity Results Path is where the results of your sensitivity run will be saved. By default, this is in the "Results" folder of your model, but can be changed through this menu.
Parameters
The parameter list includes an expandable section where distributions are defined for each parameter. For parameters that are not contained in singular entities, individual entity IDs may be specfied.

Seven distributions are supported. The appropriate parameters are displayed for each entry.