|
<< Click to Display Table of Contents >> 2. Compare Runs |
  
|
| Show/Hide Hidden Text |
|
<< Click to Display Table of Contents >> 2. Compare Runs |
|
| Show/Hide Hidden Text |
Here we will see how to create different runs by changing input values in Input Data initialization files. We will also see that different runs can be compared by making a line chart of a variable, and selecting runs to include on the graph from the Scenario Entity Overview panel.
A video of this exercise and the next is available:
Stages of Ventity™ Modeling |
In this run, we will ... |
Stage 1 - Define entity types Design the kinds of entities
|
No need - already done!
|
Stage 2 - Initialize the model Specify how many entities and their individual characteristics
|
We will change the inputs to the model during initialization
|
Stage 3 - Run the model Configure time settings and perform calculations
|
We will set up and run two different simulations, using different initial values. |
Stage 4 - Examine results See model behavior in graphs and tables
|
The line plot will now show the original results, and the results from changed inputs.
|
We will pick up from where we left off at the end of Exercise 1.
If you built that model, open it, or if you didn't, you can open the model called Exercise 1 Complete by clicking [here] or by navigating to it in your Documents > Ventity Projects > Sample Projects folder. Then, from the file menu, choose Save As..., and save it as Exercise 2.
The only entity type we want in this simulation is a pasture, and we designed the "pasture" entity type in Exercise 1. No changes are necessary, so this stage is complete.
|
Initialization is where we specify how many entities we want, and their initial values. We will initialize the next run by keeping the same number of entities (1 pasture) but changing its initial grass height, from the default value of 2 cm, to a new value of 5 cm.
Our first step is to create an Input Data set that is different than the default.
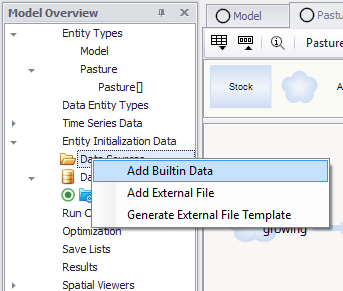
1. In the Model Overview panel, expand the Entity Initialization Data tab and right-click on Data Sources and select Add Builtin Data.
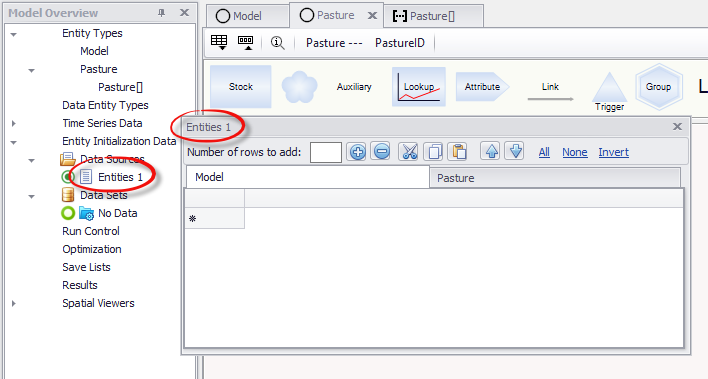
This creates a new builtin data file, which will appear under the Data Sources tab, and the builtin data set editor will automatically pop up.
In future, the builtin dataset editor can now be accessed by double-clicking the builtin data file under the Data Sources tab. The
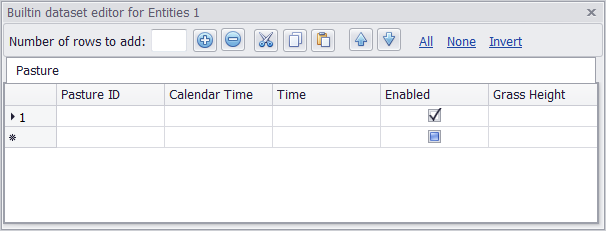
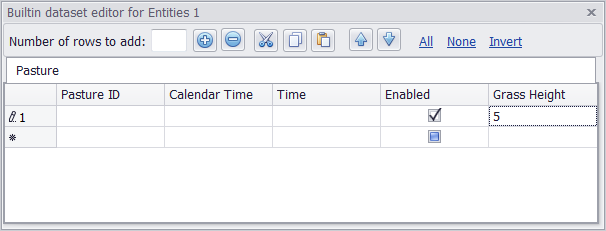
2. In the builtin dataset editor, there is a tab for the entity type "pasture". Enable one pasture by left clicking on the check box beneath "Enabled". Our purpose now is to change the initial grass height as, unless we change it, the run will use the default value (which we set to be 2cm when we designed the pasture entity type in Exercise 1). The Time and Calendar Time columns will be discussed later.
3. For the new run, change the initial height of the grass in our pasture to 5 cm. The Enter or Tab keys will record the changes,
4. Close the window by clicking the
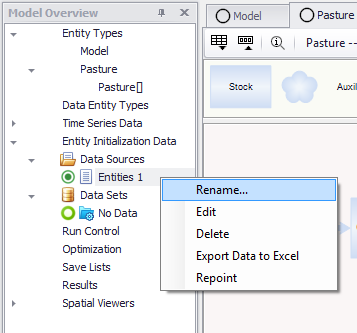
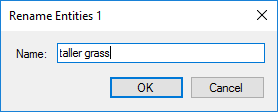
5. To complete this stage, let's rename the built-in data set. In the Model Overview panel, right-click Enitites 1 in the Data Files tab and choose "Rename". Type a more descriptive name such as "taller grass".
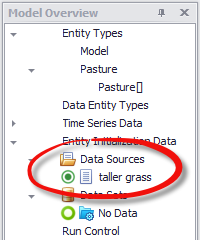
6. Click OK, and the Input Data section of the Model Overview will show the "taller grass" builtin file as part of the Data Sources folder.
The aim of the initialization data is to specify how many of each entity type will be in the model and their individual characteristics, and we have specified that there shall be one pasture entity, with an initial grass height of 5 cm. The builtin data file has been created, and now we're ready to run. |
We're not going to change the time configuration for this run, so all we need to do is run the model. However, our aim is to compare to this run to the run we did in Exercise 1. If you've restarted Ventity since you did Exercise 1, or if you didn't do Exercise 1, don't worry, because we will re-run that case while we are running the current case.
7. In the Model Overview, either double-click Run Control, or right-click it and choose Edit. Click the
Each row of run control produces a separate simulation run. In this exercise we will do two: the first run will reproduce the results of Exercise 1, and the second will make use of the "taller grass" input data set we just created. In the Data Sets column, you'll see both rows display "Use active dataset". If we left this alone, both runs would use whichever data set was selected in the model overview. However, we want the two runs to use different data sets, so let's enter that information explicitly.
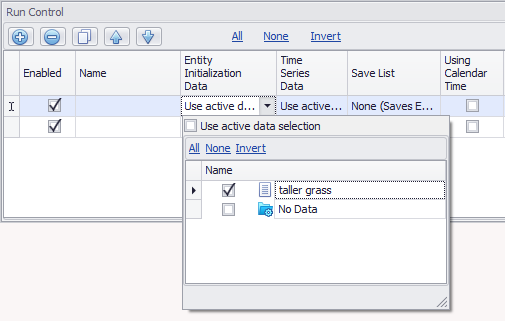
8. In Run Control, ensure both Runs are Enabled by checkmarking both checkboxes under the Enabled tab. Left click on "Use active dataset" of the first Data Sets, and a drop-down menu will appear. Uncheck "Use default dataset" and you can select individual data sources or data sets to use for this run. Select the "taller grass", the data file we previously created, and click anywhere outside of the drop-down menu.
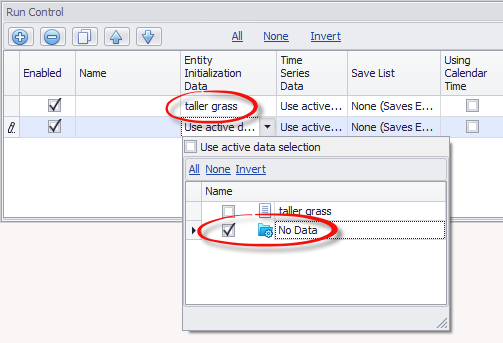
9. In the second row, choose "No Data" (which will use the default values for the Run).
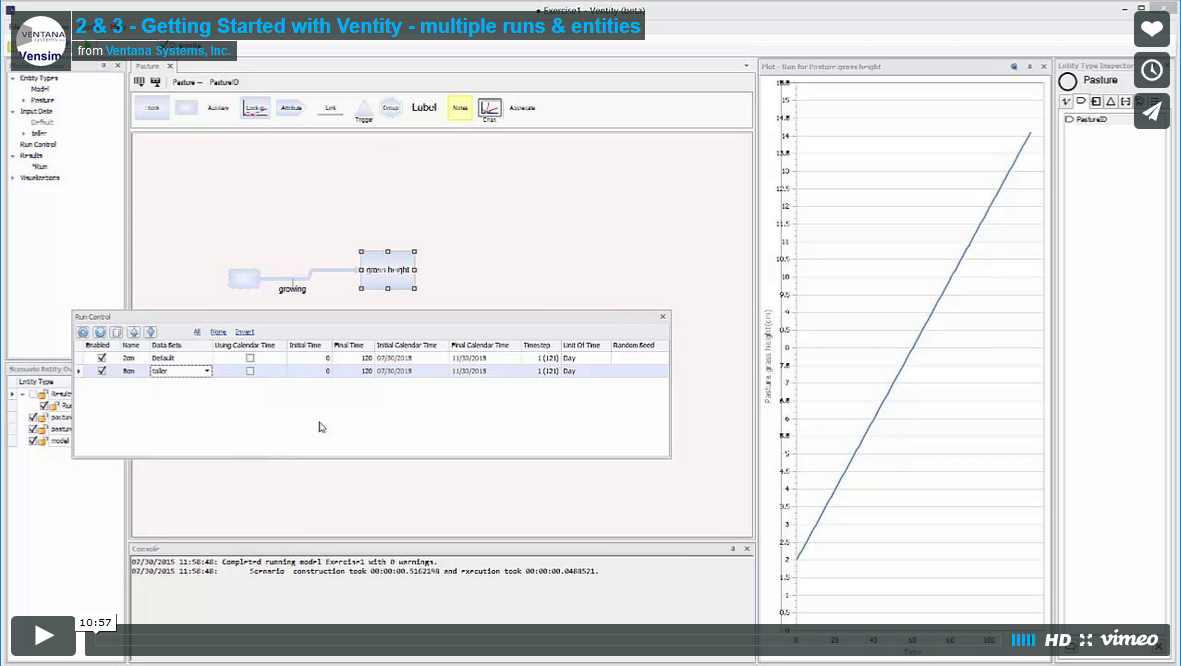
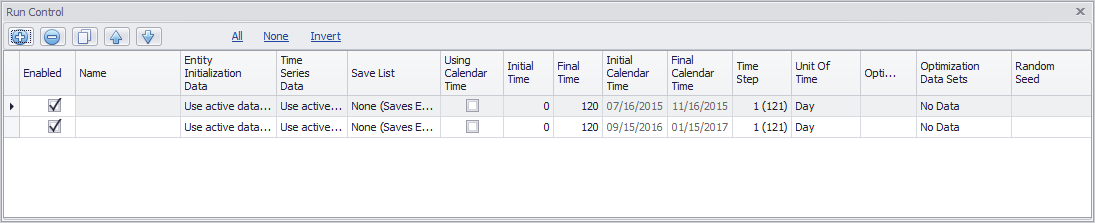
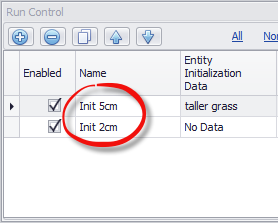
10. It will be helpful to refer to each simulation by a different name, so we will use the Name column. We will name the repeated simulation from Exercise 1 "Init 2cm" and the simulation using the taller-starting grass "Init 5cm", by entering those names in the Name column. When finished, the Run Control panel should look as follows:
Run Control is now set up so that, when you push the Run button, Ventity will run two simulations: one called Init 2cm, using the default initial values from model equations, and one called Init 5cm, using the taller grass Builtin Data File to override the default values: specifically, to have the grass start out 5cm tall instead of the default 2cm. Close the Run Control.
Before you push the green button to run the two simulations, note the Run Name box just to the left. Type in "Ex2" (for Exercise 2).
We will discuss this in a moment, but first, press the green button!
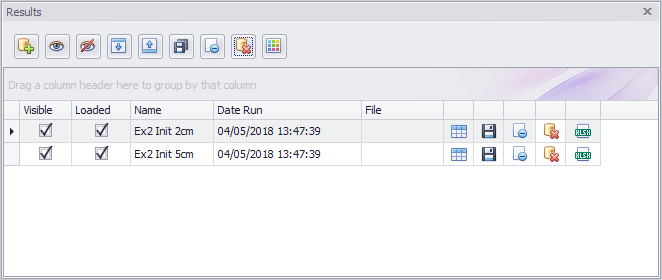
You should see confirmation in the console that the run has completed. To view the results, right click on Results in the Model Overview and select "Edit".
Note the names of the runs: "Ex2" from the top toolbar name field has been used as the start of the name for both runs, and the individual names you entered in Run Control has been used as the end of the name. You are not required to enter names in both places. If either field is blank, it will not be used. So, you can enter names in the top toolbar, or in run control, or both as we've done here. You can even leave them both blank, and Ventity will generate run names as needed. For details, see Naming Runs.
|
We now have two runs calculated, and we can compare their outputs.
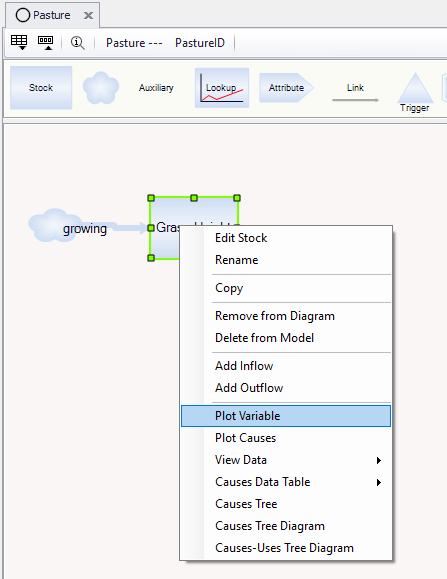
11. If you don't already have a line chart open of Grass Height, right-click Grass Height and choose Line Chart.
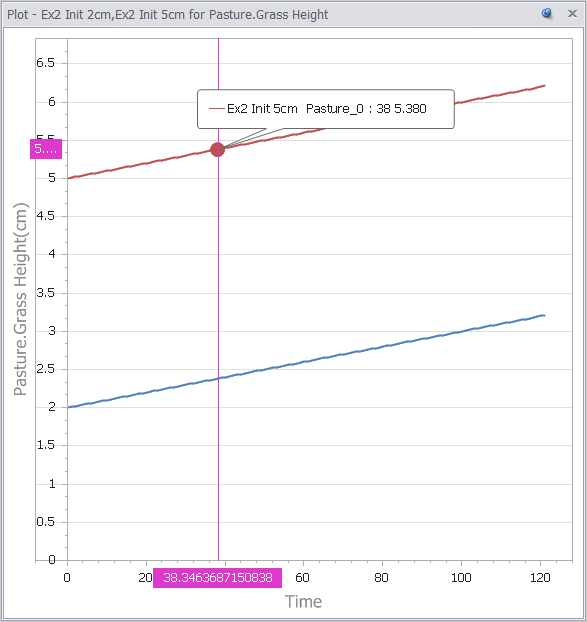
You'll now see two curves: one from Ex2 Init 2cm with grass starting at 2 cm high, and one from Ex2 Init 5cm starting at 5 cm. Float your cursor near either line to get specific values of any point:
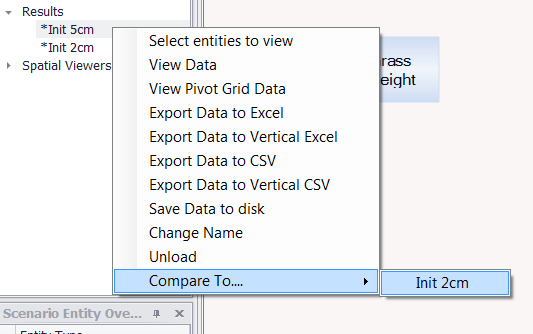
For a summary of differences between the runs, right click the results of the 5cm run (Init 5cm), navigate to Compare To... and select Init 2cm.
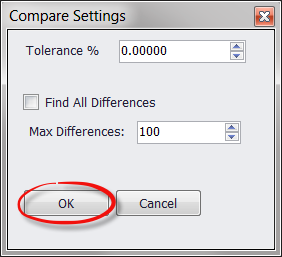
This will cause a Compare Settings box to appear. For now, we'll leave these settings as they are. (More information on these settings is available in Compare Runs). Click OK.
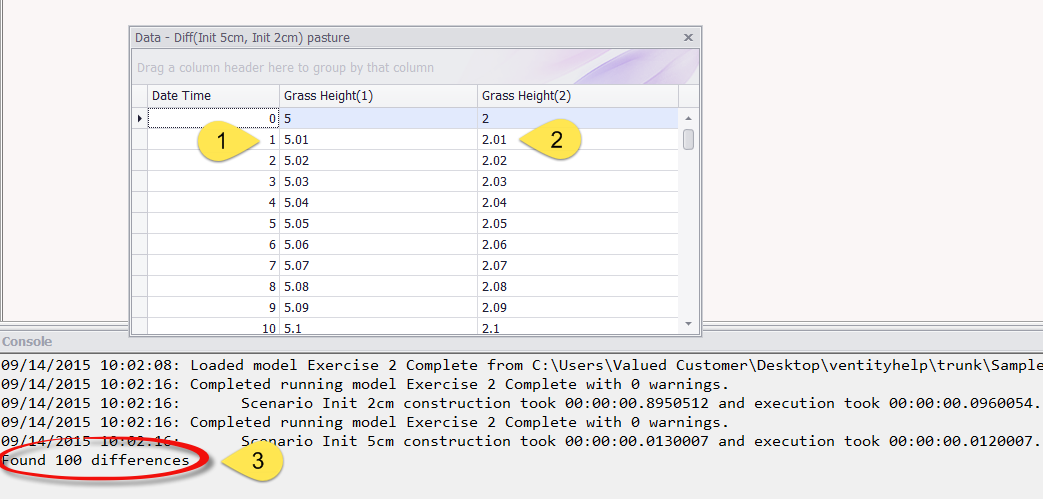
The Compare To... tool will populate a table with all of the differences it found up to the cap you chose. Since our stocks started with difference initial values and had the same amount flowing into them, they have a different value at every 121 timesteps of the model run, so all of those differences are recorded--up to the cap of 100 differences that we selected.
In summary, •Runs are initialized to different starting values by using different Input Data initialization files. •Different input data sets can be selected for different runs using Run Control, where you can either select an Input Data set explicitly, or choose "Use active dataset" to use whichever input data has been selected in the Model Overview. •Runs are named from the top toolbar Run Name field, or the Name column of the Run Control grid, or a combination. |