|
<< Click to Display Table of Contents >> Causes and Uses Tree Diagrams |
  
|
|
<< Click to Display Table of Contents >> Causes and Uses Tree Diagrams |
  
|
The Causes and Uses Diagrams are useful tools for running through a model and identifying the causes of change, or uses for change, of a particular variable in a model.
The Causes Diagram is accessed through right-clicking on the node you're interested in tracking and selecting Causes Tree Diagram. This will automatically populate a dialog box with all of the causes for that node.

There are a few things to note about the Causes Tree Diagram:
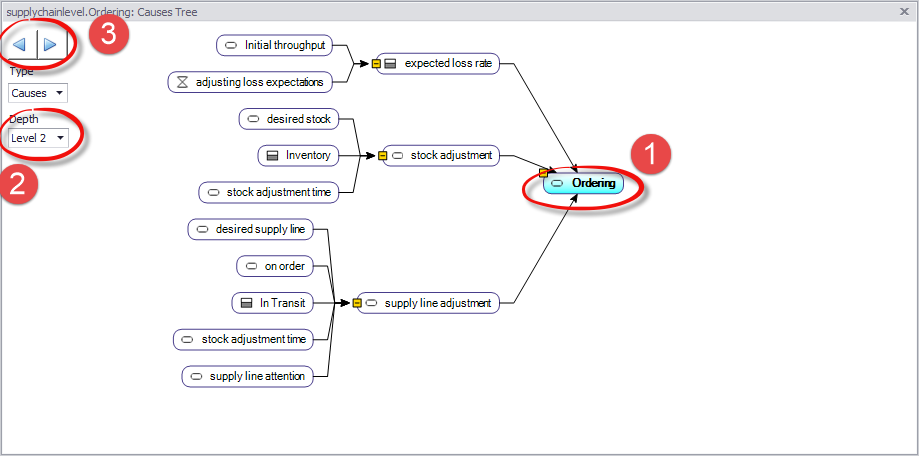
1. The initial node selected. From this node, all of the causes broken up by levels will be shown, going from the initial causes, to their causes, and so on until a repeat, loop, or the Depth Level is reached.
2. Depth controls the number of levels of information that are displayed on a single screen, ranging from one level of depth up to ten.
3. The forward and backward buttons can be used to shift between different displays within the Causes Tree Diagram. If you double click a node on the tree to make it the new "initial node", or change the Depth Level, then you can navigate back to the previous screen (or forward, from those) with these buttons.
The Uses Tree Diagram works in the same way, displaying the Uses of a variable rather than its Causes, with the Causes and Uses Tree Diagram, predictably, displaying both the Causes and the Uses of a single node.
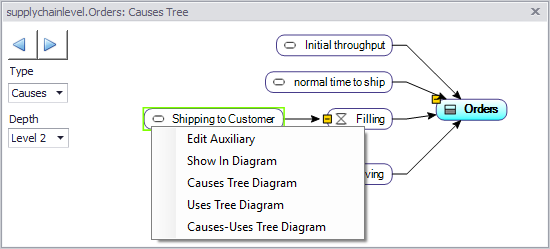
In both trees, all of the variables can be selected by right-clicking them, opening a dialog box which allows you to open the variable, go to its place on the diagram, or create a new Diagram with that variable as the initial node. Additionally, by simply double-clicking a single node on the Diagram Tree, you can set that node as the initial node.

As of Version 4.9, the causes tree color-codes variable types and traces through actions and triggers, which can be very useful for understanding the sequence of events initiated by a trigger:
