|
<< Click to Display Table of Contents >> Ventity™ Panels and Windows |
  
|
|
<< Click to Display Table of Contents >> Ventity™ Panels and Windows |
|
When a model is open, the Ventity™ workspace appears, consisting of a number of panels. A common arrangement (and the default) is to have model diagrams in the center, surrounded by utility panels:
Notes:
•You can rearrange panels as you wish. Drag the title bar of any panel either to float it, or to dock it by dropping it onto the desired station in the docker.
•You can pin any panel, minimizing it until the tab that is created is moused over. This can be very helpful for clearing a lot of screen space. For more details on this feature, click [here].
•Any panel may be closed with the close button on the upper left.
•Panels may be opened from the View menu, or in many cases, by double-clicking a related object.
•When you start a session, Ventity will open the previous session's model with its panels arranged as you left them. If no model was open at the end of the previous session, Ventity will open the home screen.
Information follows on each of Ventity's panels.
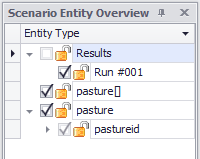
The Scenario Entity Overview is used while examining results, to select which entities from which runs are included in graphs. Check or uncheck the boxes and locks to determine which combination of entities will be included.
The Scenario Entity Overview appears by default in the lower left of the workspace. If it is not visible, you can raise it from the View menu.
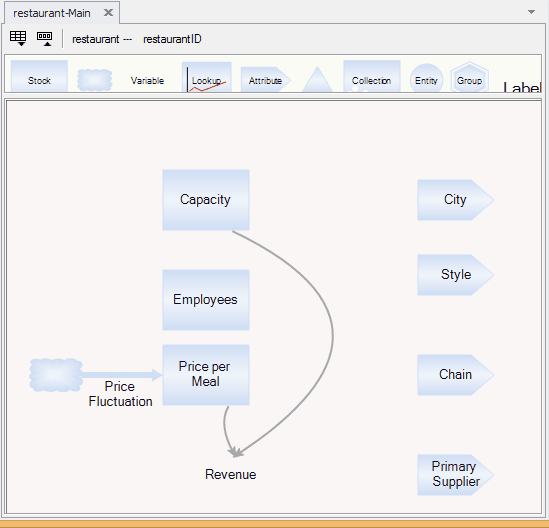
Diagrams appear by default in the upper center of the workspace. To raise the diagrams for a particular entity type, either
•double-click the entity type from the Model Overview, or
•double-click an entry on the diagrams tab of the inspector for the entity.
The diagrams screen can be zoomed in/out of by selecting the diagrams screen and, while holding the Ctrl key, scrolling the mouse wheel in or out.
The Console panel is displayed by left clicking View and selecting "Console".
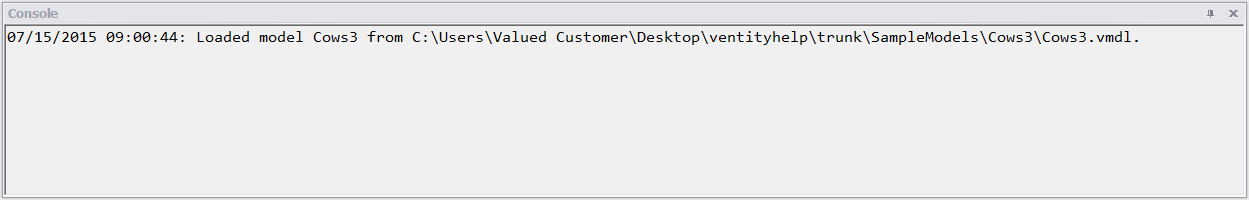
Information about the run, or issues with it, will be displayed here, along with bugs or errors that Ventity encounters. The Console panel had variable zoom for ease of use, accessible by selecting the panel by left clicking anywhere in the Console screen and, while holding the Ctrl key, scrolling the mouse wheel.
The Units window can be displayed by left clicking View and selecting "Units".
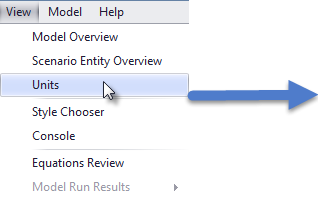
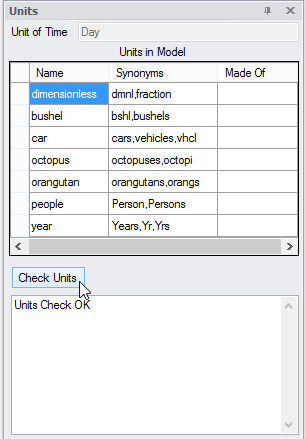
This screen allows you to view all of the units defined in your model, and to view synonyms for those units. So, for instance, if you had a stock of octopus and a flow of octopi, then the synonym listed in your Units window would ensure Ventity wouldn't read this as an erroneous input.
The Check Units button causes Ventity to automatically check to ensure units in your model match, and will display errors if, for instance, a stock or flow have no units--or if you have a stock of apples drained by a flow with units of oranges. If your units agree, then it will display "Units Check OK" as pictured above.
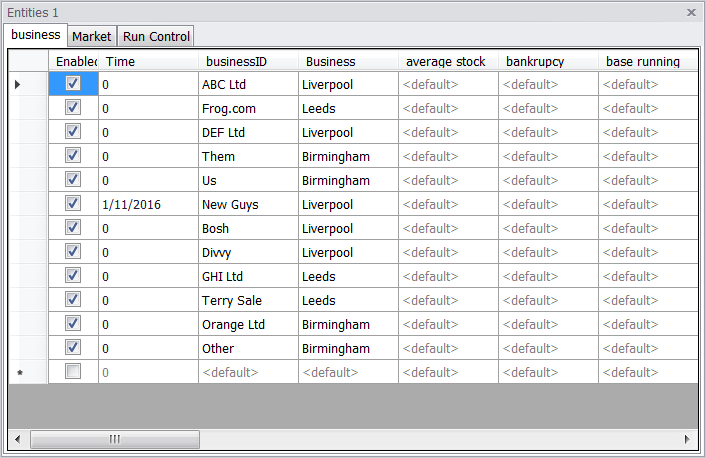
Input Data window can be opened by double clicking on any entity listed below an input data previous created under the Input Data tab of the Model Overview panel.
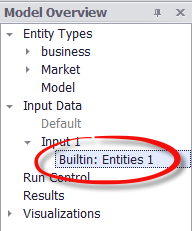
This will bring up the Input Data window where any variable marked as a constant can be assigned a unique value for any number of new entities that will be created for the run.
For more information about the Input Data window and its uses, refer to Create Input Data Sets and Use Input Data Sets.
Style Chooser
The Style Chooser window can be displayed by selecting "Style Chooser" under the View tab.
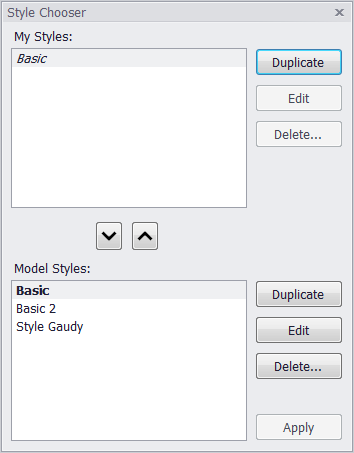
Here you can select and edit which Style you wish to utilize. Styles that are specifically saved to the model will be displayed in the Model Styles box. Styles saved and accessible throughout Ventity, regardless of model, will be displayed in the My Styles box.
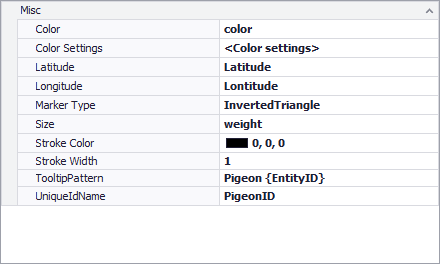
The Spatial Viewer can be accessed by first mapping variables in your model to the Viewer. For information on how to do this, see Spatial Viewers.
After the mapping has been completed, simply run the model then right click on your results and select "X Y Size Viewer".
The visualizer will pop-up in the Ventity workspace. Manual controls are listed on the top, but you can also control the viewer by left clicking anywhere on the visualizer and using the arrow keys to move the displayed area in the viewer in a direction corresponding with the key. The page up and page down keys will tilt the viewing lens, and scrolling the mouse wheel will control the zoom.
These options can be useful for tracking an individual element, or for tracking the movement of variables off of the initial screen. Each of the orbs in the screenshot above represent a rabbit, with the size of the rabbit representing its weight (based mainly on how long it has survived). Each of the orbs can be selected and their data viewed by right clicking on the sphere. A dialog box will appear.
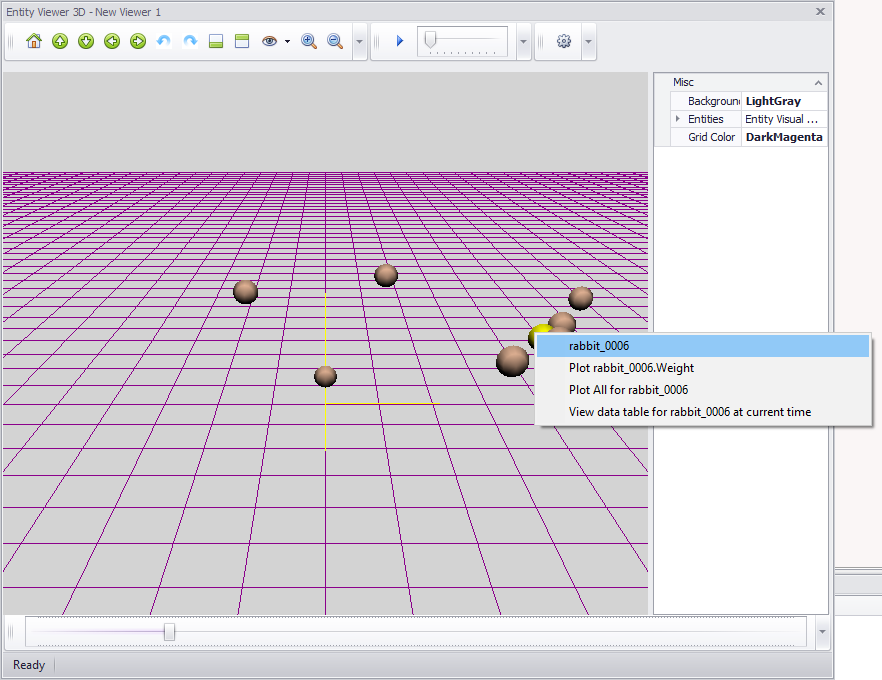
Going line by line, rabbit_0006 is the name of the entity.
Plot rabbit_0006.Weight at plots the Weight of the rabbit from its birth to the current time of the model run.
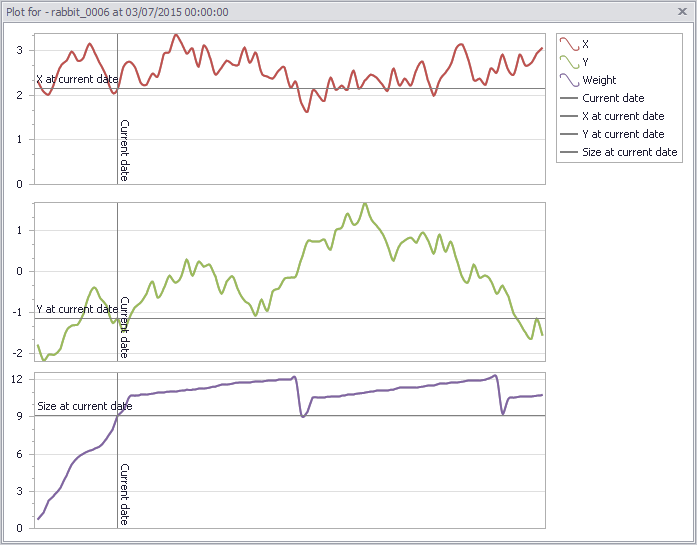
Plot All for rabbit_0006 plots the progression of all three variables of the rabbit from its birth to the current time of the model run.
View data table for rabbit_0006 opens the data table sorted by the selected entity variable (here, for rabbit_0006).
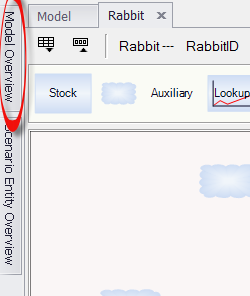
Pinning panels allows you to minimize panels you might not want open at all times, only causing them to appear upon mouseover, saving screenspace. To pin a panel, simply locate the "pin" (![]() )icon in the top right of the panel.
)icon in the top right of the panel.
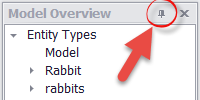
Left click on the pin, and the panel will be hidden in a tab automatically generated on whichever side the panel was located on.
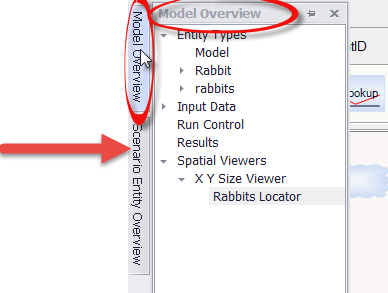
 *Note that in this image, both the Model Overview and Entity Overview have been pinned, and so both appear along the left side of the Ventity Workspace screen.
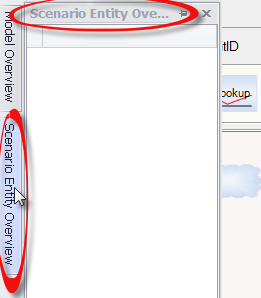
Now, upon mousing over the tab, the panel will appear on your screen.
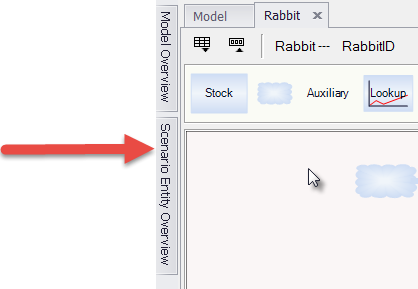
You can temporarily dock an individual panel to your screen by left clicking on its tab. It will then remain on screen, even when your mouse is not actively hovering over it. It can be deselected (and re-hidden) but simply left or right clicking on anything outside of the panel itself.
