|
<< Click to Display Table of Contents >> Wilshire 5000 |
  
|
|
<< Click to Display Table of Contents >> Wilshire 5000 |
|
This model of the Wilshire 5000, an index of the U.S. stock market, is provided as a very simple example of using Data Entities for data input and Optimizing to calibrate. The model simulates Wilshire 5000 index price using a simple linear model, with a different slope/intercept pair for each calendar year. Actual historical price data are also available from a data entity, and the model calculates the squared error between the simulated price and the actual historical price.
To do this, the model contains two main entity types (in addition to the standard model entity).
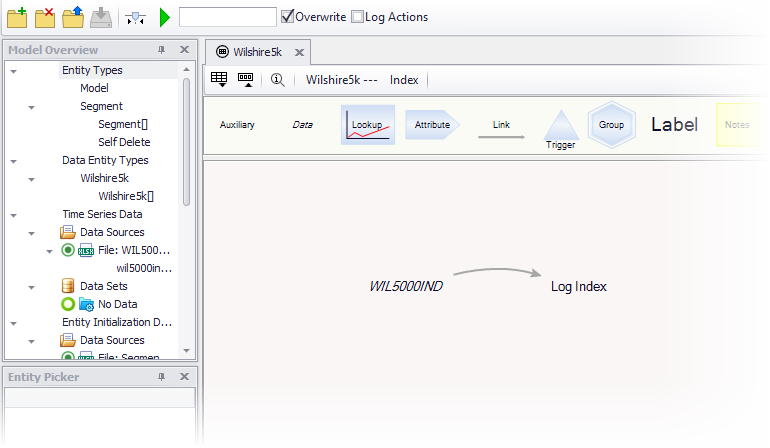
The data entity type is called Wilshire5k. Only one entity of this type is in the model, and it is mapped to a single source file containing historical Wilshire 5000 price data. That entity type includes the data variable WIL5000IND. An additional variable, log index, simply takes the log of the historical price.
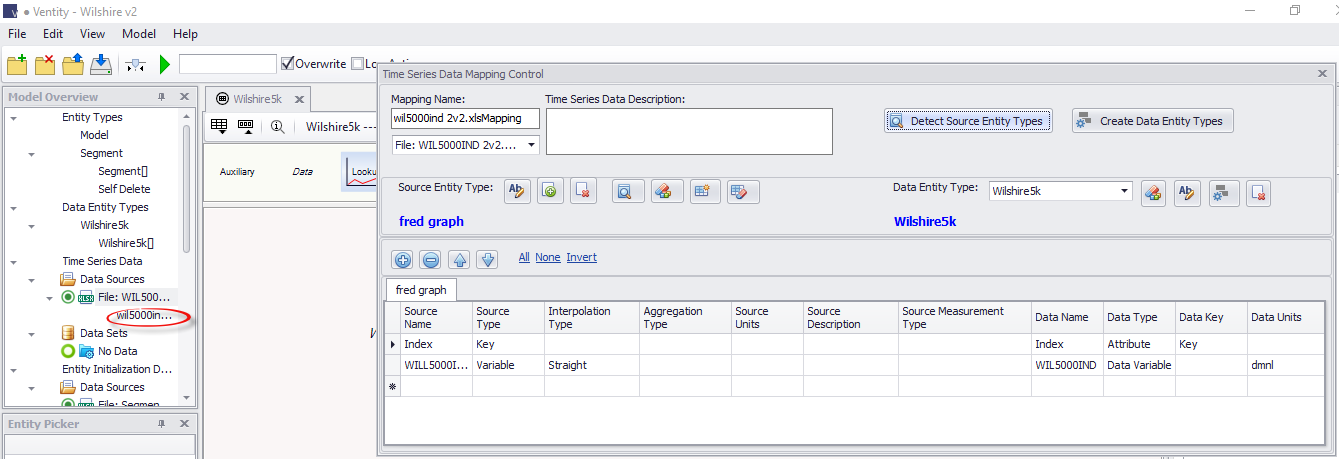
Right-clicking on the name of the data map (circled in red in the figure below) raises the map control, showing the name of the variable in the source file WILL5000IND and in the data entity WIL5000IND. The data map makes it possible to rename the variable in Ventity without breaking the connection to the variable in the source file.
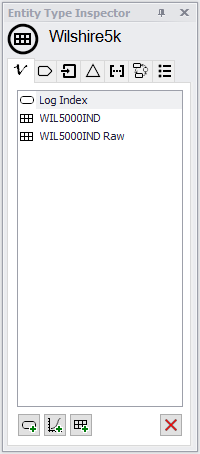
You can see in the inspector that the WIL5000IND input has two data variables: a raw version (WIL5000IND raw) that reports values only at the times they appear in the data source file, and an interpolated version (WIL5000IND) which reports values in between provided values using straight-line interpolation
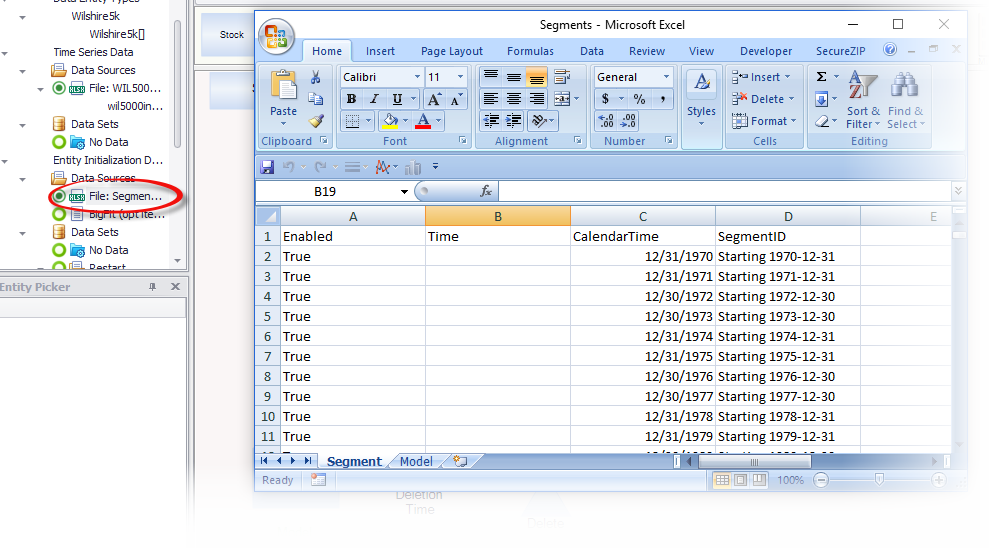
The entity type representing the simulated index price is called segment. Each segment entity represents one calendar year of simulated Wilshire 5000 index prices, and you can see in the initialization data that segments have been created for each of 47 years from 1971 (starting 31 December 1970) to 2017 (starting 30 December 2016).
In each 1-year segment, the model calculates the squared difference between the historical Wilshire 5000 index price and a linear model of the price:
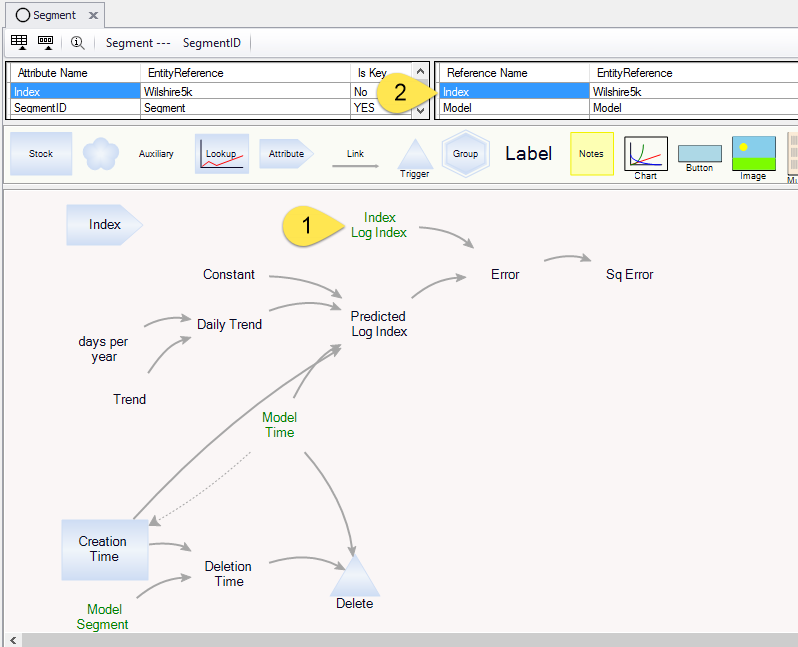
Note the shadow variable Index Log Index (item 1 in the figure above). This variable is a reference (item 2) to the data entity: it provides the actual historical data (interpolated linearly) to the computations in each segment entity.
The rest of the variables in this model create and compute a linear model of the log of the price, called predicted log index. From there, the error is computed between the model prediction and the actual historical value, and the error is squared in the variable Sq Error.