|
<< Click to Display Table of Contents >> Output Tables |
  
|
|
<< Click to Display Table of Contents >> Output Tables |
|
To create a table of all results in a run, either
•Choose Model Run from the View menu, and then select a run, or,
•Right-click the desired run under Results in the Model Overview (Example).
Either will give you a menu with these choices:
This raises a table of all data in the chosen run, for the entities selected in the Configure Viewed Data control (see below). Each entity type has its own tab. On a tab, each row shows the values at one time step for one entity.
•To sort rows, click any column heading. Click again to reverse the sort.
•To sort rows by multiple entities, simply hold shift while clicking the column headings of the entities you wish to sort by. For instance, by sorting by "date" and "product name" you'll see all of the relevant entities for "day 1" and "product 1", "product 2", etc. before product data for "day 2" is displayed.
•Filter out rows by floating the cursor over the upper right corner of a column heading to reveal the filter symbol, then clicking it.
•Group rows into collapsible subsets with common values in a column by dragging that column header to the "group by" area toward the top of the window.
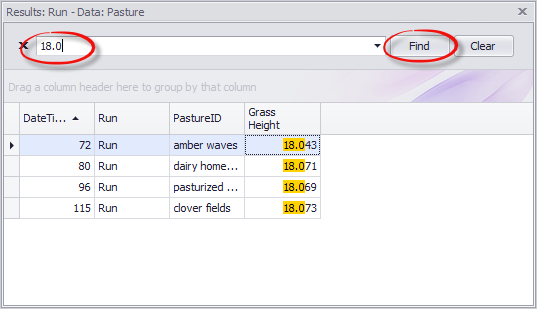
•To search for specific results, while the data table is selected, hold Ctrl and press F to open a search bar at the top of the data table. Results of the search will be highlighted on the data table below, or you can press the Enter key or click "Find" to only display the results of your search. If you clear a search query and search again, all records will be displayed.
This raises a control where you can check (or uncheck) entities that will be included in the View Data table described immediately above.
This raises a pivot table of all results from the chosen run.
•Whichever header is dragged to the data area (top left) determines what is shown in the cells.
•Sorting: Headers in the row area (just below the data area) determine the sort order of the rows of the table. Headers in the column area (to the right of the data area) determine the sort order of the columns.
•Filtering: Any header can act as a filter. Float your cursor near the top right corner of the header name and click on the filter icon. If you want to filter by a heading, but not use it for sorting, you may drag it to the filter area at the top of the window, above the data and column sort areas. When filtering you have several options:
oShow only available items
oRadio mode (only one item on the list may be selected and shown)
oInvert filter (select everything that was not selected while unselecting everything that was selected).