|
<< Click to Display Table of Contents >> Chart Manager |
  
|
|
<< Click to Display Table of Contents >> Chart Manager |
|
The Chart Manager is a tool for tracking and savings the charts you want for your model, all located in the same location.
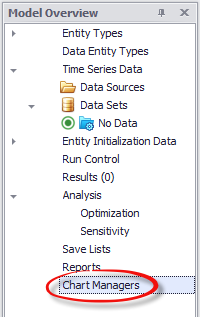
To navigate to the Chart Manager, simply scroll to the bottom of your Model Overview tab. The Chart Manager will be located beneath the Reports options. This is where all of your Chart Manager options will be located.
Creating a New Chart Manager:
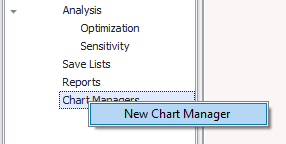
To create a new Chart Manager, you can either right-click on the Chart Manager and select "New Chart Manager". This will create a new Chart Manager with the default name of "Chart Manager 1". Alternatively, bringing up any chart by right-clicking on a stock, flow or variable and selecting "Plot Variable" will create and add this variable to a new Chart Manager if one does not already exist with the default name of "Chart Manager 1".
Editing your Chart Manager:
Once created, you can edit your Chart Manager by right-clicking on it in the Model Overview tab.
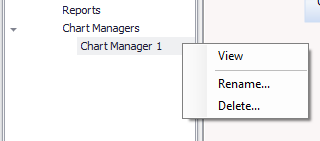
View: Opens the Chart Manager and provides additional options for editing.
Rename: Renames the selected Chart Manager.
Delete: Deletes the Chart Manager, removing all of the charts and saved properties of that Chart Manager.
Upon selecting "View" or "Plot Variable", the Chart Manager will appear, as pictured below.
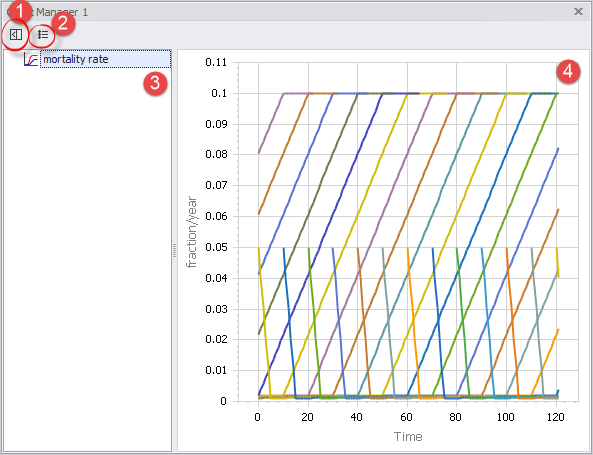
1. Hide Tree button. This controls whether or not the tree, where all of the charts saved in this Chart Manager, are displayed. In the example above, this would mean whether or not the chart "mortality rate" and the space that display area takes up appears.
2. Edit Chart Properties button. This will display the Chart Properties Editor, containing all of the options for editing the currently selected chart. Alternatively, this same dialogue can be accessed by right-clicking on the chart you'd like to edit in the Chart Manager and selecting "Edit Chart Properties". There are many ways to customize the display of your charts through the use of this Editor, including changing the display of the title, bars, variables displayed, entities included, limits of the axises, and more. For more on this powerful tool, scroll down or click [here].
3. Chart Titles. The list of your charts and their titles. Charts added via "Plot Variable" will default to using the name of the variable. This can be changed by right-clicking the chart you'd like to edit in the Chart Manager and selecting "Edit Title".
4. Chart Display. This is where the currently selected chart will be displayed.
•Right-clicking on the Chart Display will provide additional options:
1.Show Entities (up to 15) displays charts (up to 15) with only the individual entities listed.
2.View Data provides the data for just the selected variable.
3.Edit Chart Properties allows you to access the Chart Properties Editor.
4.Export Chart allows you to save the chart as a image file (.pnd, .jpg, .pdf, etc.)
5.Print Chart will print the currently selected chart.
•Additionally, right-clicking on a line or point on the graph will provide additional options:
1.Casual Tracing displays a casual trace for the selected entity. For more information, see Casual Tracing.
2.Plot Causes displays the "causes" of this variable. For more information, see Causes and Uses Tree.
3.Plot Uses displays the "uses" of this variable. For more information, see Causes and Uses Tree.
Chart Properties: This dialog box can be accessed by right-clicking a chart and selecting "Edit Chart Properties" or by left-clicking the "Edit Chart Properties" button in the Chart Manager. Once you've done this, you'll see a dialog box like the one below, but before we jump into what all of the options are, a few quick notes:
•Changes made in the Chart Properties dialog will only apply to the selected Chart, with the exception of Data Styles.
•Data Styles will be applied globally, but can be overridden by local settings. For instance, if you wanted, generally, all cow entities to be colored black but on a specific chart wanted one cow entity to be displayed as yellow, you can set that on that chart.
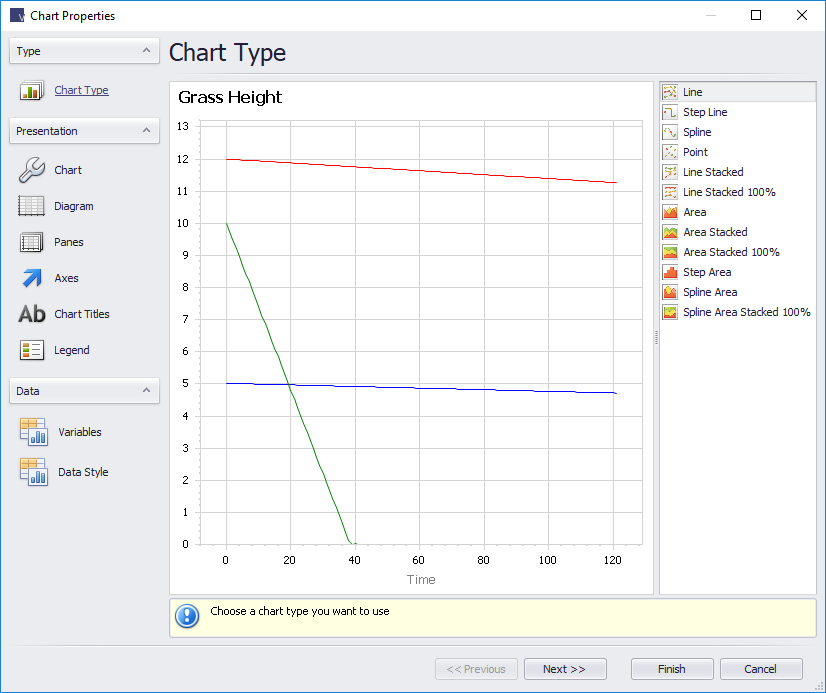
Chart Type allows you to choose between what kinds of the lines you want to be displayed on this chart.
Presentation
Chart provides options for the background of the chart itself. There are three tabs on the right that provide additional options for effecting specific parts of the chart.
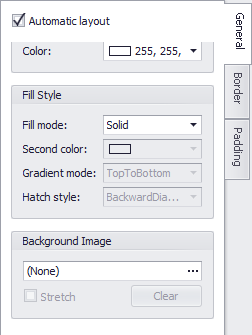
Diagram contains options for editing the margins of the chart and for exchanging the x and y positions of the model's charted properties.
Panes has options which effect the borders of the chart.
Axes has options for the parameters and display of the x and y axes.
Chart Titles contains options for adjusting the position, alignment, color and font of the chart's title.
Legend toggles the visibility of the legend and has a multitude of options for adjusting how and where the legend is displayed with the chart.
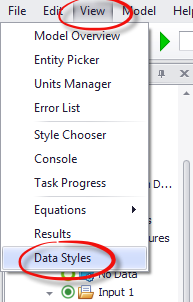
Data Styles. There are two ways to access the Data Styles tabs. The first is through a specific chart or through the Chart Manager, and will only apply the changes made to that specific chart. The other is by selecting "View" on the title bar of Ventity and selecting "Data Styles". This will open the same dialog as what appears when you access it through the Chart Manager, but these settings will be applied globally unless changes have been made to the Data Styles of an individual chart.
Variables allows you to pick which variables, entities, auxiliaries, flows or collections you want to display on your charts. When viewing a chart, the various entities displayed on that chart will already be selected, and de-selecting them will remove them from the chart similar to the functionality provided by the Entity Picker.
Data Style is used for setting the specific color, line style, thickness and whether or not it is displayed with a legend of a specific variable or entity. This can be useful for keeping your charts consistent, so that the entity "Yellow Cow" always appears as a dotted yellow line if it is present on any given chart.