|
<< Click to Display Table of Contents >> Model Overview |
  
|
|
<< Click to Display Table of Contents >> Model Overview |
|
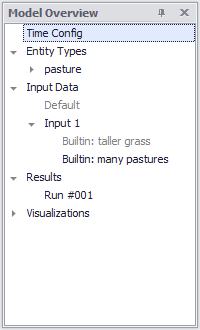
The Model Overview provides access to most of the model definition and model results. The default location for the Model Overview panel is in the upper left corner of the workspace. If it is not visible, raise it by choosing View>Model Overview. Click on the ">" to expand a folder and show its contents. Right click on the main folder to add new entries.
The Model Overview panel is used throughout the modeling process:
•Model Maps are used to present high level diagrams of the relationships between entity types, collections, and actions
•Entity Types lists the defined entity types, their collections and their actions. Double-clicking on any of these will raise the inspector
•Components are model fragments that can be inserted into entity definitions
•Macros are used to create user defined functions. Some standard SD MACROS are included in Ventity.
•Data Entity Types are used manage time series information that can be used in the model. Data entity information is not modified during a simulation
•Time Series Data is the information that is loaded into data entities
•Entity Initialization Data is used to provide initial values to create entities used in the model
•Run Lists are sets of instructions to run one or more simulations.
•Results can be double clicked to access a grid view of any results that are currently loaded
•Sensitivity Definition is used to define the parameters for running Sensitivity Analysis. The definition must be referenced in a Run List entry in order for it to be run
•Optimization Analysis is defined with parameters for the payoff functions and for parameter ranges that are to be examined
•Save Lists are used to the size of model result files and sensitivity reports. A Save List may be specified for each Run List entry.
•Reports provide access to reports for Sensitivity and Optimization
•Two types of visualization are provided -- 3D spatial and GIS
•Chart Managers contain lists of defined plots that can be referenced. Every new plot is added to a chart manager