|
<< Click to Display Table of Contents >> Causal Tracing |
  
|
|
<< Click to Display Table of Contents >> Causal Tracing |
|
Causal Tracing is a useful tool for quickly reviewing and making changes to your model through a tabular interface.
To access Causal Tracing, you'll first need to run your model. Now, simply right-click on any stock, flow or auxiliary which you want to trace and mouse over Casual Tracing Table. This will open a list of all available run data which the trace can display.
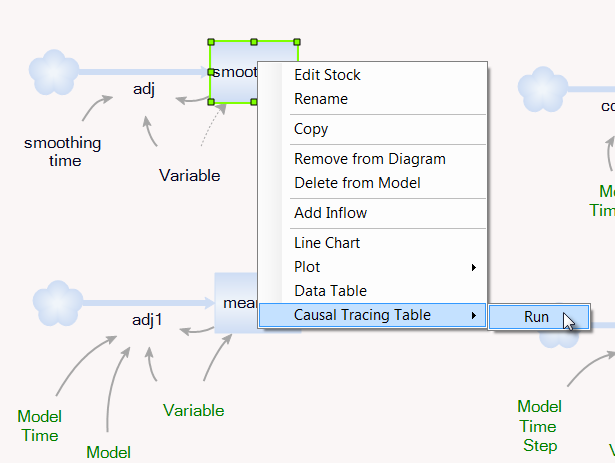
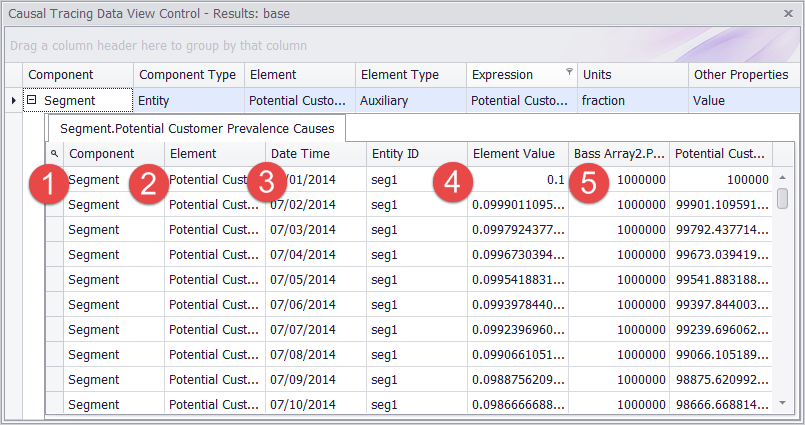
This will display a data table with the stock or flow and some additional information about it. To see the trace itself, though, simply expand the data table by clicking the ![]() box. This shows all of the data for that stock, flow or auxiliary and the other variables which directly influence it. For example, an auxiliary influenced by another auxiliary and which influences a stock will have values for the all three of those variables displayed. We'll go into more detail about what each of those means in the next section.
box. This shows all of the data for that stock, flow or auxiliary and the other variables which directly influence it. For example, an auxiliary influenced by another auxiliary and which influences a stock will have values for the all three of those variables displayed. We'll go into more detail about what each of those means in the next section.
Understanding the Trace
Every Causal Trace on the data table will share a few similar characteristics. These are:
1. Component
This is the entity for the traced variable. In the case of ghosts, this may be different from the diagram where you selected the variable.
2. Element
This is the name of the variable as it appears on the diagram.
3. Date Time
This is the date time or time slice in your model run for the values that are being displayed.
4. Entity ID and Element Value
The entity ID is the name and number for the entity that was created at model start, and the element value is the value of that entity at the given time slice.
5. Influences
This entry will list as many variables as are directly influenced or influenced by the traced variable with their Element name as the column header and their values at the given time slice beneath it.
As with all data tables in Ventity, these tables can be sorted and manipulated in a variety of ways. For more information on manipulating data tables, click [here].